Supporting materials
Download
Download this article as a PDF

Biology, maths, and the SDGs: estimate the CO2 absorbed by a tree in the schoolyard and compare it to the CO2 emissions of a short-haul flight.
Global warming and the associated climate change are the greatest challenges facing humankind over the next ten years. A reduction in the levels of the greenhouse gas carbon dioxide (CO2) plays a key role in mitigating climate change. As trees absorb CO2 to generate their own biomass, they are part of a global strategy to reduce CO2 levels. But how many trees are needed to offset one flight, for example?
This project starts with the following question: how many trees from the schoolyard are needed to remove the CO2 released when someone takes a plane trip? The worked example in this article is based on 680 kg of CO2, which is one person’s CO2 emissions for a round-trip holiday from Germany to Mallorca by air, but teachers can also pick a destination of equivalent distance from their city or look up the emissions for a more locally relevant route.
In the following materials, students estimate the carbon-storage capacity of a tree in the schoolyard or nearby and compare that to the CO2 emissions of an aeroplane trip, as well as using a Geogebra sheet to better understand intercept theorem. In addition to mathematical content, students recognize the importance of trees in mitigating anthropogenic CO2 emissions through CO2 uptake through photosynthesis and reflect on CO2 emissions in everyday life. This multidisciplinary project ties together curriculum topics from multiple subjects, from maths (geometry and ratios) to biology (photosynthesis) and chemistry (organic compounds and molecular masses). It also ties in with the 17 UN sustainable development goals (SDGs), of which the preservation and protection of the environment on land and water, as well as access to quality education, are key objectives.
The activities are suitable for students aged 11–16, with younger students working through the steps and the teacher explaining everything, and more independent problem-solving and in-depth discussion for older students.
Trees need CO2 for their growth, but too much CO2 is responsible for global warming. To slow down the resulting climate change and to limit global warming to 1.5°C, according to the Paris Climate Agreement of 1995, CO2 emissions have to be reduced to net zero by 2050 and greenhouse gases have to be removed from the atmosphere by 2100.[1–3]
Students should know that trees absorb CO2 and understand the role of CO2 as a greenhouse gas in the atmosphere. However, it is often wrongly assumed that CO2 is stored. Trees only use carbon (C) to generate biomass by photosynthesis. If one wants to describe the climate effect of trees correctly, one must speak of carbon binding and not of CO2 binding.
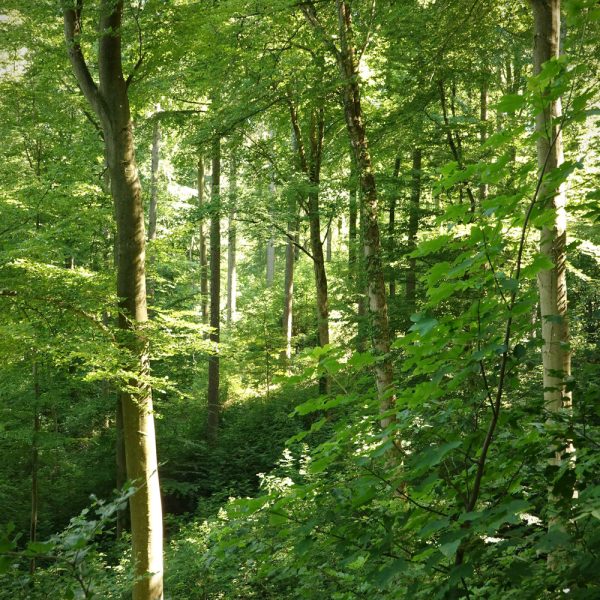
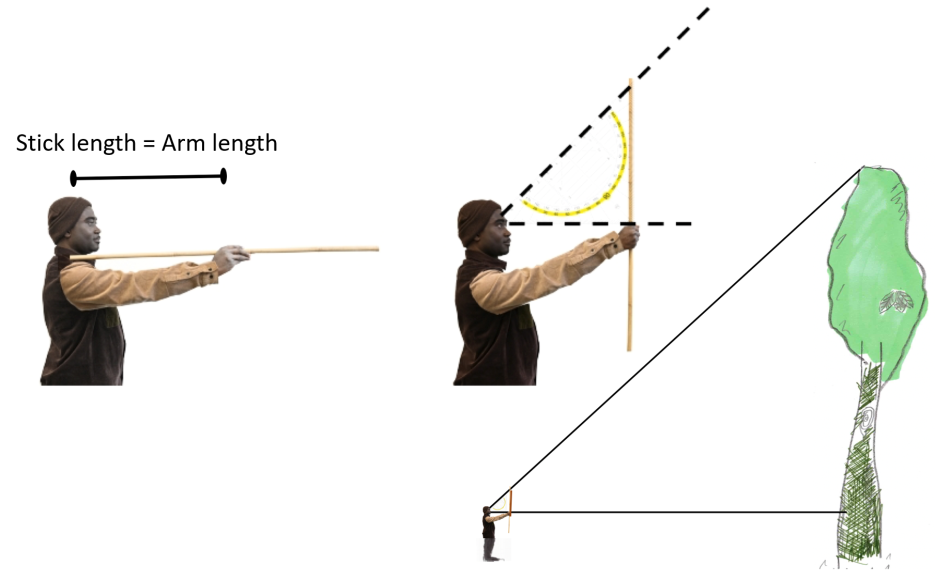
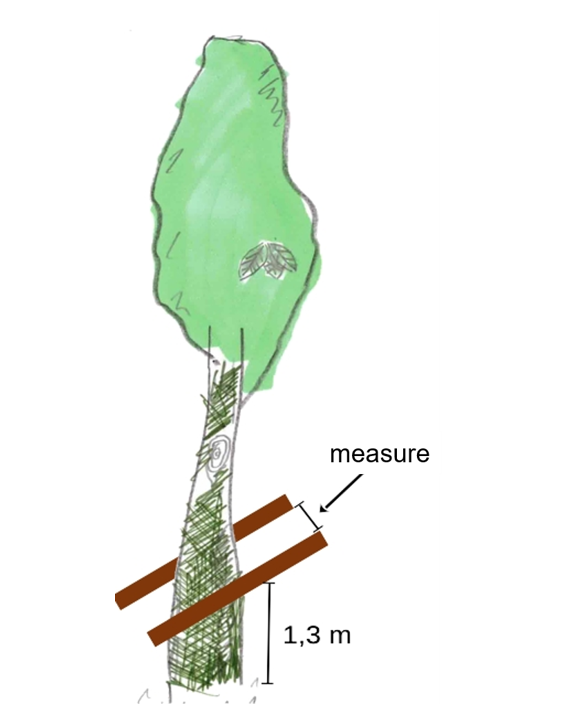
To estimate the amount of CO2 taken up by a tree, one has to estimate the volume of the tree based on its height and diameter at breast height (DBH), defined as 1.3 m, which is the internationally standardized height at which to determine a tree’s diameter.[4,5] A common method for estimating the height of a tree is based on the so-called forester triangle (the walking-stick method), which is based on the intercept theorem. Subsequently, the weight of the calculated volume is determined with the help of the specific weight of the wood of the respective tree species. Notably, this does not include the roots and the amount of biomass, such as sugars given to fungus via the roots into soil, and in general, the roots contribute approximately 30% of the total biomass of a tree.[5–7] Moreover, the sugars from photosynthesis are also used for growth, respiration, and conversion into amino acids and lipids. Therefore, calculations in this activity reflect a rough estimation.
Given that approximately 50% of the dry weight of wood is carbon (although this is a simplification: C content varies among species[8]), one has to divide the calculated weight by two to obtain the amount of C in kg. Finally, to calculate the mass of CO2 absorbed, the C content of the tree must be multiplied by 3.67 (see molecular mass of CO2).
Considering, that every tree species has its own shape and weight, there are different estimation tables available. For simplicity, this activity does not differentiate between different tree species, but is limited to deciduous broadleaf and coniferous trees.
Before proceeding with the practical part of the lesson, a class discussion introduces students to the main question and encourages them to think about the different aspects of the answer.
This activity should take around 30 mins.
In this activity, students select a tree, measure its DBH, and use a forester’s triangle to measure the height. The forester’s triangle is first employed before teaching intercept theorem to show the practical relevance of this method.
This activity takes around 30 mins.
d = C/π
where d=diameter and C=circumference.
For younger students, it may be sufficient to know how the forester’s triangle works, and to discuss the kind of triangles shown on the diagram and their basic properties (a right-angled isosceles triangle). But with older students, it may be valuable to explore the mathematical theory (intercept theorem) behind the forester’s triangle by employing a mathematical simulation. For this, you can use the Intersect Theorem activity in the supporting material.
Finally, the students can use their measurements (height and DBH) to determine the amount of CO2 the tree has absorbed in its lifetime by employing estimation tables.
Broadleaf trees, such as beech and oak, generally grow more slowly than conifers (such as spruce or fir) and have denser and more complex vascular bundles, which makes them harder and heavier. This is why conifers are often referred to as softwoods and broadleaf trees are often referred to as hardwoods, although there is considerable variation between species. For this reason, separate estimation tables for conifer and broadleaf trees are given.
We offer two approaches.
1) Using worksheet 2, students first estimate the amount of carbon atoms fixed in the trunk and branches of the tree, and from that, they can then calculate the amount of absorbed CO2.
2) In a simpler alternative, students use worksheet 3 to obtain the amount of CO2 directly from the estimation table without further calculations.
Subsequently, the students can calculate how many trees of similar type/size/age would be needed to absorb the CO2 produced by a flight of 2 × 1.343 km by dividing 680 (CO2 released by the flight) by the amount of CO2 having been absorbed by the measured tree.
This activity takes 20 minutes.
The results can be used as a basis for discussion or further research/class projects on a number of themes. Possible questions include the following:
Overall, it is important that students understand how vital forests are for the planet and why we need to protect them, but they shouldn’t come away with the simplistic idea that we can keep releasing CO2 at the current rate and global warming can be solved by simply planting trees.
We thank Mr. Minka Aduse-Poku for his support.
We thank the Bayerische Landesanstalt für Wald und Forstwirtschaft for providing the estimation tables.[9]
We are very grateful to the FNR Waldklimafonds (supported by the German Federal Ministry of Food and Agriculture and the German Federal Ministry for the Environment, Nature Conservation, Nuclear Safety and Consumer Protection) for funding our project, WaldKlimaLehrpfade (funding code: 2218WK27X5), in which the teaching sequence presented here was developed. Further teaching materials (in German) can be found on the website https://waldklima.uni-koeln.de.
[1] Friedlingstein P et al. (2021) Global carbon budget. Earth System Science Data 14: 1917–2005. doi: 10.5194/essd-14-1917-2022
[2] United Nations Environment Programme’s Paris Agreement: https://unfccc.int/sites/default/files/english_paris_agreement.pdf
[3] Smith S et al. (2023) The State of Carbon Dioxide Removal 1st edition. OSF. doi: 10.17605/OSF.IO/W3B4Z
[4] Burns RM, Honkala BH (1990) Silvics of North America: Volume 2, Hardwoods. U.S. Department of Agriculture, Forest Service, Washington, DC. ISBN: 0160292603
[5] Brokaw N, Thompson J (2000) The H for DBH. Forest Ecology and Management 129: 89–91. doi: 10.1016/S0378-1127(99)00141-3
[6] Sinacore K et al. (2017) Unearthing the hidden world of roots: root biomass and architecture differ among species within the same guild. PLoS ONE 12: 1–22. doi: 10.1371/journal.pone.0185934
[7] Harrison MJ (2005) Signaling in the arbuscular mycorrhizal symbiosis. Annual Review of Microbiology 59: 19–42. doi: 10.1146/annurev.micro.58.030603.123749
[8] Lamlom SH, Savidge RA (2003) A reassessment of carbon content in wood: variation within and between 41 North American species. Biomass Bioenergy 25: 381–388. doi: 10.1016/S0961-9534(03)00033-3
[9] Klein D, Schulz C (2011). Kohlenstoffspeicherung von Bäumen. LWF-Merkblatt 27.
Institut Laue-Langevin (ILL)
Are there other ways of capturing CO2 from the atmosphere? Researchers are investigating a variety of possibilities at ILL! For example, salty water can act as a carbon sink, trapping CO2 in deep saline aquifers with high pressures and temperatures. Scientists are in the process of studying what happens to this CO2. Another exciting approach is to capture and re-use CO2 by converting it into chemicals that are useful to make pharmaceutical drugs and other high-value products.
This cross-curricular activity encourages teachers to make the most of trees on their school grounds. A set of three hands-on tasks, enable pupils to explore the intercept theorem at the same time as supporting the delivery of a wide range of topics, from photosynthesis and the carbon cycle to climate change and sustainability. By estimating tree height, pupils can get to grips with geometry and ratios, whilst considering the bigger picture in terms of carbon offsetting and the value of forested landscapes.
Samantha Dobbie, Birmingham Institute of Forest Research (BIFoR), UK
Fresh water is a scarce resource on our planet – but how many of us are aware of how much water is needed to make the foods we eat every…
Sketch graphs from ‘story’ videos of everyday events to help students understand the basic features of graphs and how to interpret…
Plants today are extremely diverse, abundant, and flamboyant. However, the first land plants, which initiated a great change in the flora and fauna on planet Earth, were very different.