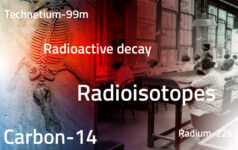
How to teach radioactive decay and radioisotopes to students who feel that equations are boring? Here are two inexpensive and captivating activities to apply in your classroom!
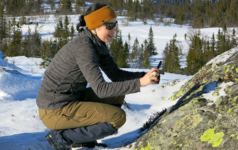
Super (role) models: Use stories about real scientists to inspire, build confidence, and help the next generation of innovators envision their place in STEM.
Ages: 11-14, 14-16, 16-19; Topics: Biology, Chemistry, Earth science, Engineering, General science, Health, Mathematics, Physics, Science and society, Careers in STEM, Resources
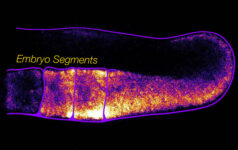
Tick tock: Did you know that there are secret clocks ticking inside living organisms, including us? Let’s dive into the science of biological oscillators.
Ages: 16-19; Topics: Biology, Chemistry, Health, Mathematics, News from the EIROs, Science and society