Supporting materials
Presentation evaluation rubric (PDF)
Presentation evaluation rubric (doc)
Debate evaluation rubric (PDF)
Debate evaluation rubric (doc)
Download
Download this article as a PDF


Which is better: tap or bottled water? Try these activities based on simple analyses, a debate, and a blind tasting to learn about drinking water and encourage sustainable habits.
Water management is crucial to sustainable development, because clean freshwater is essential to human health and well-being. Many prefer bottled water over tap water, but this has a high environmental impact in terms of waste production and pollutants. Many beliefs are related to preconceived ideas rather than to actual experiences or product characteristics: in most EU countries, tap water is controlled, safe to drink, and usually tastes good.

These activities aim to determine students’ views on the topic and influence changes in water consumption and perception. They will increase their knowledge and trust of distributed drinking water and consider the overconsumption of plastic bottled water.
We devised the following activities for students aged 16–19. They are also suitable for ages 14–16 if there is less emphasis on titration methods and chemical reactions.

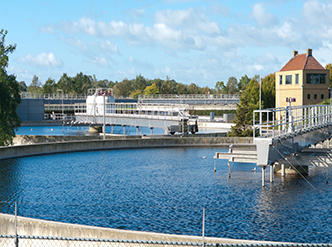
Firstly, students are given some background information on types of drinking water and invited to do some research on the drinking water in their area.
This activity involves 1 hour of introduction and 2 hours of homework.

To explore different types of drinking waters and the consequences of our consumption habits, students conduct research and then run a class debate on tap water versus bottled water.
As an alternative, the debate can be left until after Activities 3 and 4, as a consolidating activity at the end.
This activity takes about 3 hours: 1 hour of introduction and research, 1 hour to prepare arguments, and 1 hour for the debate.
The argumentation skills of each participant, in terms of presentation and content, can be evaluated using the debate evaluation rubric.
After the debate, the class can discuss what they’ve learned. Invite students to share things they didn’t know before or found surprising. Will this affect their drinking habits?
Students can analyze their home/school tap water or marketed bottled waters.
For tap water, they should compare the analytical results with the certificates of analysis provided by the local water company; for bottled water, they should compare them with those shown on the labels.
The determination of the total hardness in water is made by titration with ethylenediamine tetraacetic acid (EDTA), which forms colourless stable complexes with Ca2+ and Mg2+ ions at pH = 9–10. These ions are naturally present in water due to minerals that dissolve as water passes through soil and rocks.
To maintain the pH of the solution at 9–10, a buffer solution (NH4Cl + NH4OH) is used. The indicator Eriochrome Black T (EBT) changes colour when these two ions are completely complexed by EDTA.
In addition to the hardness test described here, other tests can be proposed, depending on time and instrument availability, such as:

This activity takes about 2 hours. Time is also needed for preparing solutions and equipment (1 h; this can be done by the teacher or technician).
Wear lab coat and gloves

1 ml sodium EDTA solution (0.01 M) = 1F° = 10 mg/l CaCO3
There are a number of different common official measurement units for hardness:[1]
– Parts per million (ppm) is usually defined as 1 mg/l CaCO3. It is equivalent to mg/l without a specified chemical compound.
– French degree (°F or f): 10 ppm or mg/l CaCO3. Lowercase f is often used to prevent confusion with degrees Fahrenheit.
– Degree of general hardness (dGH) or German degree (°dH, deutsche Härte): 10 mg/l CaO, equivalent to 17.85 ppm or mg/L CaCO3.
– Clark degree (°Clark) or English degrees (°e or e): one grain (64.8 mg) of CaCO3 per imperial gallon (4.54609 litres) of water, equivalent to 14.254 ppm or mg/l CaCO3.
– US degree (gr/gal): a grain CaCO3/gal (US gallon = 3.78541 litres), equivalent to 17.118 ppm or mg/L CaCO3.

Research shows that tap water is just as safe as bottled water and is often not significantly different in taste. Tap water is generally a better option, since it has a much lower environmental impact and costs considerably less.
This activity is useful to work out common perceptions around the topic and discuss water-drinking habits. The duration depends on the number of participants in the blind-tasting session (at least 50 are required for statistically significant results).
Bottled waters should be selected to include a highly advertised luxury brand, to show how price and advertising do not have a significant impact on taste preferences.
If the tap water is very hard and/or does not taste so good, it can be replaced with filtered tap water.
The tasting results can be statistically processed (e.g., test results in terms of number of voters, % assigned to each type of water (pie chart), and choice motivations) and collected in a poster or digital presentation.
They can be shared and made public through the school website, social media, and/or a poster exhibition encouraging the benefits of sustainable drinking habits.
In many blind taste tests, participants find bottled water to be indistinguishable from tap water, and tap water is often the favourite one, showing that many beliefs are related to preconceived ideas rather than to actual experiences or product characteristics.
This teaching and learning activity was developed as part of the MULTIPLIERS Horizon 2020 project by Iren, an Italian multiutility company and one of the MULTIPLIERS partners, through its educational department Eduiren and in cooperation with the Pascal upper secondary school in Reggio Emilia.
MULTIPLIERS promotes open schooling across Europe to make science more meaningful and directly relevant to real-world challenges. By connecting students with universities, informal education providers, museums, local associations, industry, civil society, policymakers, media, and other actors in authentic learning settings, the project promotes competence development in socioscientific issues that have a direct impact at the local level and beyond. The ultimate goal is to foster social transformation by enabling students to act as “knowledge multipliers”, sharing their learnings and findings with their wider communities.
MULTIPLIERS has received funding from the European Union’s Horizon 2020 research and innovation programme under Grant Agreement No. 101006255.
Learn more about the project: https://multipliers-project.org/
[1] The Wikipedia entry on how to measure hard water: https://en.wikipedia.org/wiki/Hard_water#Measurement
Seed extracts from the Moringa tree have been used for centuries to help purify water in regions where clean water is not available. Researchers at the Institut Laue–Langevin (ILL) and the European Synchrotron Radiation Facility (ESRF) have used neutrons and X-rays, respectively, to identify and characterize key proteins underlying the unique water purification properties of Moringa seeds. This information may allow better use of this abundant resource for sustainable water purification.
Full link for United Nations statement: https://www.unep.org/interactives/beat-plastic-pollution/?gclid=EAIaIQobChMIm7eEuP6SgAMViX5MCh1XWQNZEAAYBCAAEgKFR_D_BwE
The United Nations Environment Programme (www.unep.org) highlights the severe environmental, social, economic and health consequences of our addiction to single-use plastic products. Hence, this article, encouraging teachers to get their students to think about the pros and cons of using bottled water versus tap water is very timely. The article is also very balanced with opportunities to consider when bottled water may be essential.
Within the article there are different activities that teachers could adapt for different classes, including using internet research and the generously provided material provided with the article to understand the processes used to deliver clean tap water, an organised debate, a titration to determine water hardness and organising a blind water tasting test. Some of the ideas could also be used with a science club or to provide inspiration for individual or team science projects.
This article has many curriculum and cross-curricular links.
Curriculum topics include: critical analysis of data; fair testing; practical analysis skills; practical titration skills; practical titration skills; pH and pH indicators, acids and bases; metal ions; chemistry of limestone;
Cross-curricular links include:
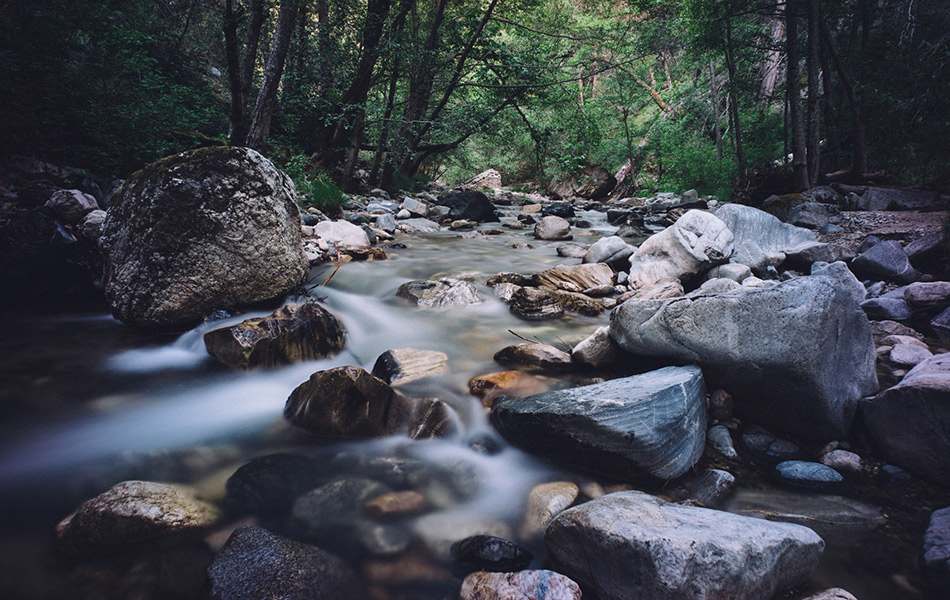
Geography – availability of clean drinking water in different countries; the geography of rivers and the ‘rivalry’ for river water.
Earth Sciences – limestone sedimentary rocks;
Biology – biological uses of water; osmosis, water as a solvent e.g. for mineral ions
Suggested discussion questions:
Sue Howarth, UK
Industrial activities and even geological changes can affect the quality of water, causing contamination that poses risks to human health and the…


Need inspiration for teaching about fresh water on Earth? Try these Earthlearningideas for classroom activities that can be performed with very…
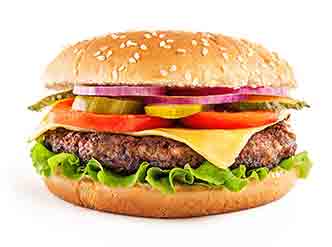
Fresh water is a scarce resource on our planet – but how many of us are aware of how much water is needed to make the foods we eat every…