Supporting materials
Download
Download this article as a PDF


The oceans cover over 70% of the surface of our planet. Try these activities to learn more about Earth’s largest habitat and how it affects our lives.

The ocean literacy (OL) principles were created to explain and underline the mutual influence between the ocean and humans.
This influence may be hard to grasp when living far from coastal areas, but you can use the simple classroom activities presented in this article (OL principles 4–7) and in the previous one (OL principles 1–3) to help students understand the importance of the ocean.
OL principle 4 – The ocean makes Earth habitable
The primordial atmosphere did not contain oxygen until the appearance of photosynthesis in marine microorganisms, which first began to produce oxygen that later diffused into the atmosphere. The subsequent formation of the ozone layer, through the action of UV rays on atmospheric oxygen, made it possible for the living organisms to colonize land.
Since then, nearly half of the atmosphere’s oxygen has come from the ocean. A simple experiment on photosynthesis and oxygen production allows us to visualize the production of this gas by aquatic plants.
This activity takes about 25 minutes: 15 minutes to set up the apparatus plus another 10 minutes for observation.

Usually, the amount of produced gas is not enough to test for oxygen. If you use more plant sprigs under a funnel feeding into a test tube, you can collect more gas and test it by removing the test tube and thrusting a glowing splint into it: it will burst into flame due to the produced oxygen (this should be done by the teacher!).
Ask the students which other photosynthesizing marine organisms they know in addition to aquatic plants (e.g., phytoplankton and algae), and challenge them to discover the role of these plants and marine organisms in the removal of atmospheric CO2 dissolved in the ocean.
As the saying goes: “every second breath, thank the ocean!”.
OL principle 5 – The ocean supports a great diversity of life and ecosystems
Extending over 71% of Earth’s surface with an average depth of nearly 3.7 km, the ocean is the largest living space on our planet, ranging from warm water to cold water (and ice!); from shallow to deep; from sunlit to eternally dark environments.
It houses incredibly diverse communities of living organisms, from those as small as nannoplankton to those as enormous as a blue whale (the second-largest animal ever to have lived on Earth[1]).
Let’s dive in and explore an example of a food web in the Mediterranean Sea, with its complexity and a final surprise!
This activity requires about 30 minutes, plus the time needed to prepare the badges and the ribbons.


Discuss with the students the effects of perturbation on the network studied, encouraging them to propose solutions to the problems that have emerged from the discussion. You can also think of other pressures on marine food webs (overfishing, pollution, etc.) and simulate their impact.
OL principle 6 – The ocean and humans are inextricably interconnected
This is probably the most important of the OL principles, as it deals with the complex effect on an ever-growing human population (more than 8 billion in 2022) drawing biological and nonbiological resources from the ocean and spilling waste and pollution into it. The problem of microplastic pollution, which can come from some surprising sources, in the ocean is a well-known example.
An inspiring set of activities on one of the main anthropogenic impacts on the ocean can be found in a previous issue of Science in School, An ocean in the school lab: carbon dioxide at sea recently proposed by Carla Isabel Ribeiro and Ole Ahlgren.
A related activity presents the dangerous action of ocean acidification on marine calcifying organisms, which are organisms that have body parts made of calcium carbonate (CaCO3), such as molluscs, corals, and some algae. In fact, CO2 dissolved in seawater produces H2CO3, which generates H+ ions that, in turn, react with the dissolved CO3 used by calcifying organisms to build shells and skeletons, thus making this process more difficult.
This activity takes about 15 minutes, plus the time for discussion.


Ask students to explain this colour change (it is due to the chemical reaction between H+ ions and CaCO3 of crushed seashells, which produces an increase in pH, as visualized with the pH indicator).
Finally, ask students to imagine how living calcifying organisms (molluscs, corals, etc.) can be affected by ocean acidification.
OL principle 7 – The ocean is largely unexplored
Surprisingly, more details are known about the surfaces of the Moon and Mars than the seafloor. But understanding the ocean is more than a matter of curiosity: ocean conservation and sustainable use require in-depth knowledge of this enormous and still mysterious space.
Let’s address the topic of ocean exploration by means of a classroom activity on seafloor mapping by simulating the echosounder study of seafloor topography;[2] this technology promises to provide a high-resolution map of the whole seabed by 2030 (see more on the Seabed 2030 Project).
This activity takes about 30 minutes, plus the time needed to prepare the box with the mock seafloor.


You can stimulate discussion on the meaning of this kind of research by asking the students the following questions: Why, in your opinion, is it important to study seafloor topography? What other applications (good or bad) could this technique have? Possible answers include to produce better nautical maps; to explore the seafloor for oil, gas, and mineral extraction; to lay and repair undersea cables; and for military use.
You can propose another activity on Marie Tharp, a scientist who, by plotting the seafloor by mapping sonar data on ocean maps in the 1950s and 1960s, paved the way to the development of the theory of plate tectonics.
At that time, female scientists were not allowed aboard research ships. Marie was not even mentioned in most of the published papers, thus becoming an unrecognized ‘mother’ of plate tectonics theory. Earthlearningidea has a fantastic teaching activity on this topic: Marie Tharp – a woman scientist in a man’s world.[3] Other relevant materials can also be found in the Resources.

After inspiring students’ interest in the ocean, you can tell them about the Decade of Ocean Science for Sustainable Development 2021–2030, launched by the United Nations with the motto “the science we need for the ocean we want”, which is aimed at promoting science but also connecting people with our ocean.
The Decade of Ocean Science for Sustainable Development represents a good opportunity to involve students in ocean-oriented environmental projects, taking advantage of an EU initiative called the Network of European Blue Schools. A Blue School is a school that develops a project addressing topics such as the ocean, climate, water, pollution, and the 2030 Agenda, and involves at least one class and a local partner. The school communicates the project to the local community and documents the process through the network website, thereby obtaining a European Blue School Certificate. Through the project, a school can also connect with other Blue Schools in Europe and beyond, making synergies with eTwinning and Erasmus+ networks. You can also apply to become a certified European Blue School.
More information and ideas can be found in A wave of European Blue Schools: Handbook for teachers[4] and in UNESCO’s Ocean literacy for all: a toolkit.[5]

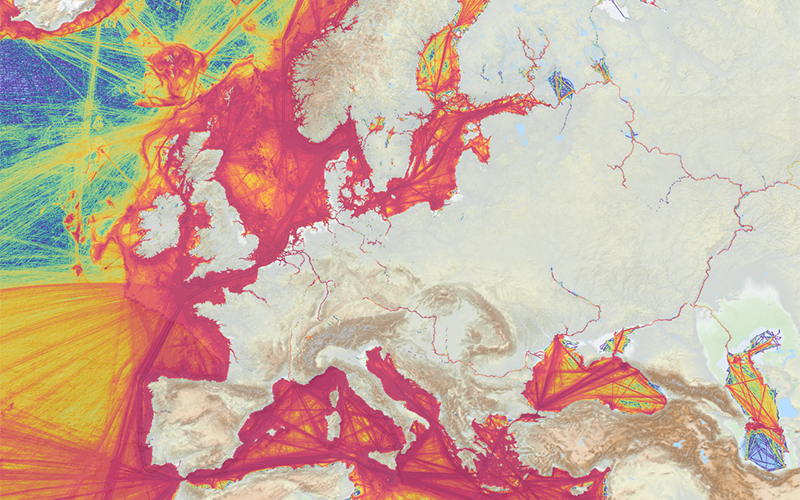
Call to become a European Network Blue School
Image: Maritime Forum, European Commission
Activity 4 and the extension activity are based on activity worksheets from Earthlearningidea.[2,3]
[1] Braucci G. et al (2023) A heavyweight early whale pushes the boundaries of vertebrate morphology. Nature 620: 824–829. doi: 10.1038/s41586-023-06381-1
[2] Activity sheet for seafloor mapping: https://www.earthlearningidea.com/PDF/351_Sea_floor_mapping2.pdf
[3] Teaching resource on Marie Tharp: https://www.earthlearningidea.com/PDF/353_Sea_floor_mapping4.pdf
[4] Copejans E et al. (2020) A Wave of European Blue Schools: Handbook for Teachers. European Commission, Directorate-General Maritime Affairs and Fisheries, Brussels.
[5] Santoro F et al. (2017) Ocean Literacy for All – A Toolkit. IOC/UNESCO and UNESCO Venice (IOC Manuals and Guides), Paris.
Download this article as a PDF
The role of our oceans in climate change is more complicated than you might…


Looking for a user-friendly interactive map-based educational tool on the ocean? Dive into the European Atlas of the…
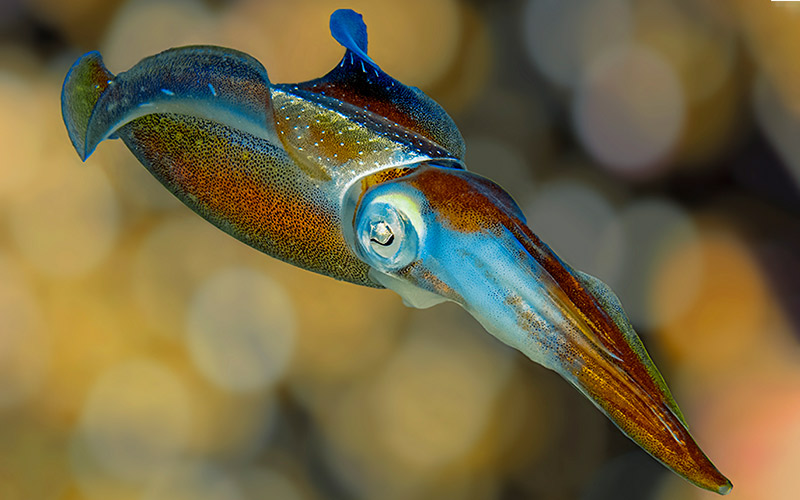
Did you know that a squid’s brain is donut shaped, so that the oesophagus can pass through it? Or that squid have three hearts? Explore the fascinating physiology of squid in this hands-on activity.