


Spectrometry at school: hands-on experiments Teach article
Nataša Gros, Tim Harrison, Irena Štrumbelj Drusany and Alma Kapun Dolinar introduce a selection of experiments with a simple spectrometer designed especially for schools – and give details of how to perform one of the activities.
Beßler / Pixelio
To motivate school students through a hands-on approach to chemistry, we and our project partners developed a collection of experiments using small-scale, low-cost spectrometers. In the project, we used a simple school spectrometer developed by one of the partners (Nataša Gros). The spectrometer can be easily upgraded to form other analytical instruments, for example gas and liquid chromatographs, allowing a further range of school experiments (see the project websitew1). Limited numbers of the instruments are available for loan to schools.
How spectrometers work
In a spectrometer, the white light from a light source (a bulb) enters a monochromator, from which only light of the chosen wavelength (colour) emerges; this then passes through a solution in the optical cell, or cuvette (see Figure 1). The solution absorbs a fraction of the light and a detector measures the resulting reduction in the light intensity (the absorbance). The deeper the colour of the solution, the higher the absorbance measurement.

Image courtesy of Nicola Graf
The most widely used cuvettes have an optical path length of 1 cm and require at least 3 ml of solution for a successful measurement. The main objective of a general-purpose spectrometer is accuracy and precision of absorbance measurement: the wavelength selection should be as accurate as possible and the light highly monochromatic (i.e., with a narrow range of wavelength). As a consequence, the construction of the instrument is complicated and not very obvious to a typical user – and the instrument itself is expensive.
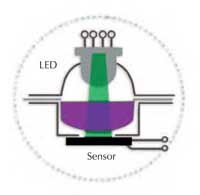
of the Spektra spectrometer
Image courtesy of Nataša Gros
Instead, the main objective when developing the SpektraTM spectrometer was to produce a low-cost, portable and robust instrument with a simple and intuitive design and operation, allowing for low reagent consumption and a simplified experimental approach (Gros, 2004). This spectrometer is primarily intended for educational purposes, especially for the introduction of concepts, but it has also proved useful for on-the-spot quantitative or semi-quantitative determinations of samples.
Spektra comprises two optical elements: a tri-colour light emitting diode (LED) and a light sensor. Blue (430 nm), green (565 nm) or red (625 nm) light can be selected; this passes directly through the liquid layer and strikes the sensor (see Figure 2). The most essential components (the light source, the measuring chamber and the sensor) are all visible: for students, the instrument is not a ‘black box’, but is easy to understand and operate (see Figures 3a and b).
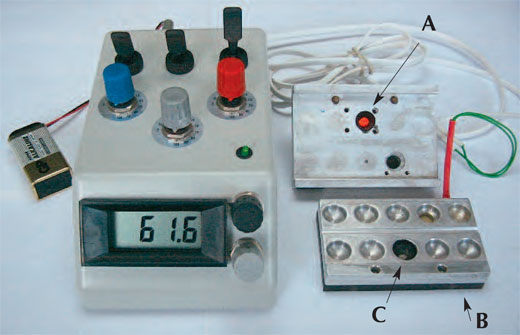
Spektra spectrometer. A: the
LED light source; B: the
measuring chamber; C: the
measuring site with the
sensor at the bottom. Click
to enlarge image
Image courtesy of Nataša Gros
Reactions and measurements take place in polymeric supports called blisters (similar to the plastic packaging on tablets), which allow for small volumes (0.35 ml) of tested solutions, rapid homogenisation of reagents, and small volumes of chemical waste. Experimental work with Spektra is simple and safe, requiring no special laboratory training or laboratory glassware. The volumes of solutions needed are very small: even a drop-based experimental approach can be used where appropriate.
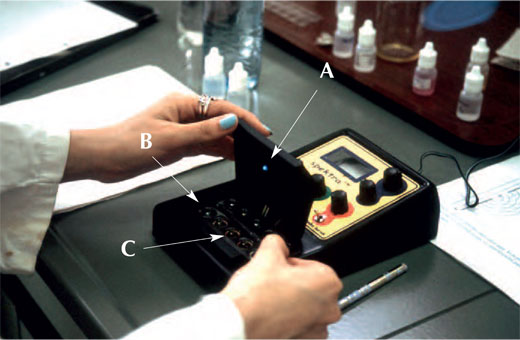
design. The instrument is
more compact, but the three
essential components (A:
light source; B: measuring
chamber; C: sensor) are still
visible. Click to enlarge image
Image courtesy of Nataša Gros
The spectrometer can be purchased onlinew2. Alternatively, the University of Bristolw3, UK, offers a limited number of Spektra spectrometers for loan by teachers who wish to either try the experiments with their students or develop other practical investigations. For teachers who prefer a conventional instrument, Mystrica colorimeters (using normal, full-scale cuvettes) are also affordable and good qualityw4.
Hands-on experiments in spectrometry
As part of the project, a range of practical spectrometry activities was developed to raise interest in science, and to inspire potential future scientists amongst school students. These activities covered topics as varied as water analysis, the physics of light and colour, investigations into Lambert-Beer’s law, chemical equilibrium, environmental analysis, kinetics of chemical reactions and the analysis of food.
The food analysis experiments cover the spectrometric determination of iron levels in samples of dried herbs or flour; alcohol content of spirits; glucose levels in jam; colour of beer; colour (quality) of paprika; phosphate levels in apple juice; phosphates and nitrites in meat products; and casein concentration in cheese. Another protocol allows the process of alcohol fermentation to be monitored.
The step-by-step instructions for determining the glucose level in jam are presented here; full details of all other experiments – including some suitable for outreach events in primary schools – are available on the project websitew1. The website also has instructions for upgrading the Spektra instrument to a gas or liquid chromatograph, together with details of experiments that can be carried out with the upgraded equipment (see also Gros & Vrtacnik, 2005).
Spectrometric determination of the glucose level in jam
A number of reactions between sugars and other chemical reagents produce coloured products; the intensity of colour is related to the initial concentration of sugar. The absorbance of sample solutions can be measured and compared to the absorbance of standard solutions of known sugar concentrations. Only a limited number of colour-change reactions are known for polysaccharides, and most involve simple sugars, usually reducing sugars (see box).
Glucose determination was chosen primarily because students know what sugars are – the activity has widespread appeal. Furthermore, determining the sugar content of jams may have industrial applications in aspects such as quality control.
One method to determine the sugar concentration of jam involves hydrolysing many of the non-reducing sugars (in jam, principally sucrose) to glucose, using sulphuric acid (H2SO4), after which the sample is neutralised with sodium hydroxide (NaOH). When heated with 3,5-dinitrosalicylic acid (DNSA; also known as 2-hydroxy-3,5-dinitrobenzoic acid), reducing sugars (e.g. glucose and fructose) produce a red-brown product. For more details of this reaction, see Miller (1959).
The concentration of the coloured complex can be determined with the spectrometer using the blue LED (430 nm): the initial sugar concentration of the jam samples can then be read off a calibration curve created using known glucose concentrations.
Equipment and reagents
- Spektra spectrometer (or other spectrometer)
- Cuvettes or blisters
- Pipettes
- 100 ml volumetric flasks
- Conical flasks
- Test tubes
- Balance
- Water bath
- Funnel
- Filter paper
- Jam samples
- DNSA reagent (3,5-dinitrosalicil acid)
- Sulphuric acid (H2SO4) solution (approximately 2 mol/l)
- Sodium hydroxide (NaOH) solution (w=10%)
- Sodium potassium tartrate (NaK(CH2OH)2(COO)2.4H2O)
- Glucose powder (C6H12O6)
Preparation of solutions
DNSA reagent: To prepare the DNSA reagent, dissolve 10 g DNSA in 200 ml NaOH solution (about 2 mol/l). Heat the solution and stir thoroughly. Dissolve 300 g sodium potassium tartrate in 500 ml distilled water to form a colour stabiliser. Combine the two solutions, stir well and top up to 1 l with distilled water.
Jam (sugars): Weigh 1-2 g jam into a conical flask and add 10 ml sulphuric acid. Heat in a boiling water bath for 20 min, stirring periodically until hydrolysis is complete. Leave the sample to cool and carefully add 12 ml sodium hydroxide. Stir and filter into a 100 ml volumetric flask, and top up to 100 ml with distilled water. Using a pipette, transfer 10 ml solution into another 100 ml volumetric flask and top up to 100 ml with distilled water to produce the test solution. Stir well.
Jam (reducing sugars): Weigh 3.0 g jam into a conical flask, add 50 ml distilled water, heat and stir for 10 min. Filter into a 100 ml volumetric flask, and top up to 100 ml with distilled water. Using a pipette, transfer 10 ml solution into another 100 ml volumetric flask and top up to 100 ml with distilled water to produce the test solution. Stir well.
Stock glucose solution (15 mg/ml): Place 1.5 g glucose in a 100 ml volumetric flask and top up to 100 ml with distilled water. Stir.
Creating the calibration curve
- Mark five volumetric flasks (100 ml) with the letters A–E. Into each labelled flask, pipette the volumes of standard glucose solution and distilled water specified in Table 1.
| Flask | A | B | C | D | E |
|---|---|---|---|---|---|
| Volume of standard glucose solution (ml) | 2 | 3 | 6 | 8 | 10 |
| Volume of distilled water (ml) | 98 | 97 | 94 | 92 | 90 |
| Glucose concentration (mg/ml) | 0.3 | 0.45 | 0.9 | 1.2 | 1.5 |
2. Label and fill six test tubes as specified in Table 2.
| Sample number | Blank | 1 | 2 | 3 | 4 | 5 |
|---|---|---|---|---|---|---|
| Standard glucose solution (flask) | N/A | A | B | C | D | E |
| Volume of standard glucose solution (ml) | 0 | 1 | 1 | 1 | 1 | 1 |
| Volume of DNSA reagent (ml) | 1 | 1 | 1 | 1 | 1 | 1 |
| Volume of distilled water (ml) | 3 | 2 | 2 | 2 | 2 | 2 |
3. Heat the test tubes and their contents in boiling water for 5 min; the DNSA reagent will react with any sugar present, producing a red-brown product.
solutions
Image courtesy of Irena
Štrumbelj Drusany
4. Cool the test tubes, add 6 ml distilled water to each and shake well.
5. Using the blue LED (430 nm) of the spectrometer, measure the transmittance of each solution.
The readings from the Spektra instrument are transmittances expressed in percentages and should be divided by 100 to obtain the transmittance values used in the subsequent calculations. Transmittance is related to absorbance as described by the equation: A = –log T. See the second and third columns in Table 3.
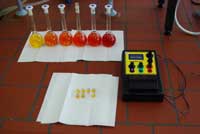
The image to the right shows the calibration solutions; even the blank (water and DNSA with no glucose) is an intense colour. It is therefore necessary to measure all the samples, including the blank, against distilled water. The glucose-specific absorbance of the samples is then calculated by subtracting the absorbance measurement of the blank from the absorbance measurement of the sample (see the fourth column of Table 3).
| Glucose concentration (mg/ml) | Transmittance (Spektra reading, T%) | Absorbance (A) | Glucose-specific absorbance (A – Ablank) |
|---|---|---|---|
| 0 (Blank) | 27.54 | 0.56 | 0 |
| 0.3 | 23.44 | 0.63 | 0.07 |
| 0.45 | 20.04 | 0.69 | 0.13 |
| 0.9 | 18.21 | 0.74 | 0.18 |
| 1.2 | 15.13 | 0.82 | 0.26 |
| 1.5 | 14.45 | 0.84 | 0.28 |
6. Plot glucose concentration against glucose-specific absorbance, as shown in Figure 5.
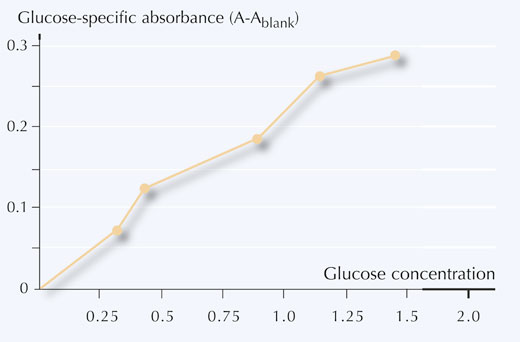
concentration of glucose
Measuring the jam samples
The jam samples should be treated similarly to the glucose solutions used for the calibration curve.
- For each jam to be tested, put 1 ml prepared jam sample (see ‘Preparation of solutions’) in a test tube and add 1 ml DNSA reagent and 2 ml distilled water.
- Heat the test tubes and their contents in boiling water for 5 min; the DNSA reagent will react with any sugar present, producing a red-brown product.
- Cool the test tubes, add 6 ml distilled water to each and shake well.
- Using the blue LED (430 nm) of the spectrometer, measure the transmittance value (T%) of each jam sample. Divide by 100 to obtain T, convert T to A using the equation A = –log T, and use that to calculate the glucose-specific absorbance (A – Ablank).
Table 4 shows an example of the transmittance values obtained and the calculated glucose-specific absorbance of each sample.
| Sample | Transmittance (Spektra reading, T%) | Absorbance (A) |
Glucose specific absorbance (A – Ablank) |
|---|---|---|---|
| 1 | 18.6 | 0.73 | 0.17 |
| 2 | 21.3 | 0.67 | 0.11 |
- Using your calibration curve, convert the absorbance measurements (A) into the concentrations of glucose (mg/ml) in your samples.
Using the examples from Table 4, the glucose concentrations read off the calibration curve give:
Sample 1: 0.8 mg/ml
Sample 2: 0.5 mg/ml
- From the glucose concentrations, calculate the mass of glucose in a 1 g jam sample using the following equation:
Mass glucose (g per 1g sample) = mass concentration (mg/ml) x 10 x 100 ml
where
mass concentration is the value read off the calibration curve
10 is the dilution (see ‘Preparation of solutions’)
100 ml is the volume of 1g of jam sample.
In our example,
Sample 1: mass glucose (g per 1g sample) = 0.8 mg/ml x 10 x 100 ml = 0.8 g
Sample 2: mass glucose (g per 1g sample) = 0.5 mg/ml x 10 x 100 ml = 0.5 g.
The calculations above assume that the initial jam sample was 1 g. If, for example, the sample had weighed 2 g, the figures above would need to be divided by 2 to get the mass of glucose in g per 1 g sample.
Reducing and non-reducing sugars
In chemical terms, a reducing sugar is an aldose such as glucose, which has an aldehyde group that can be oxidised to a carboxylic acid. The more common chemical test to detect reducing sugars is to warm them with either Benedict’s or Fehling’s solutions, which contain copper(II) ions that are reduced to copper(I) oxide and can be observed as a brown-orange precipitate.
Non-reducing sugars, such as sucrose, may have a ketone rather than an aldehyde functional group, which cannot reduce copper(II) ions. When treated with Benedict’s or Fehling’s solutions, non-reducing sugars produce no coloured precipitate.
Acknowledgements
The authors wish to thank the European Commission Directorate General for Education and Culture for the financial support of the Hands-on Approach to Analytical Chemistry for Vocational Schools II (AnalChemVoc II, LLP-LDV-TOI-2008-SI-15) project via the Leonardo da Vinci programme.
References
- Gros N (2004) Spectrometer with microreaction chamber and tri-colour light emitting diode as a light source. Talanta 62: 143-150. doi: 10.1016/S0039-9140(03)00420-X
- Gros N, Vrtacnik M (2005) A small-scale low-cost gas chromatograph. Journal of Chemical Education 82: 291-293. doi: 10.1021/ed082p291
- Miller GL (1959) Use of dinitrosalicylic acid reagent for determination of reducing sugar. Analytical Chemistry 31: 426-428.
This article is freely available from the website of the American Chemical Society. See: http://pubs.acs.org/doi/pdf/10.1021/ac60147a030
Web References
- w1 – For more information about the project, see: www.kii3.ntf.uni-lj.si/analchemvoc2/file.php/1/HTML/experiments.htm
- w2 – The Spektra instrument can be purchased from Laboratorijska tehnika Burnik: www.lt-burnik.si/index.php?newlang=english
- w3 – The University of Bristol’s ChemLabS (www.chemlabs.bris.ac.uk) offers a limited number of Spektra spectrometers for loan by teachers who wish either to try out the experiments with their students or to develop other practical investigations. Interested teachers should contact Tim Harrison (t.g.harrison@bristol.ac.uk).
- w4 – For more details about Mystrica colorimeters, see: http://mystrica.com/Colorimeter.aspx. The website also describes a number of possible experiments; particularly good are those involving enzymes reactions.
Review
Analytical chemistry relies extensively on spectrometric analysis, but professional instruments are expensive and thus not easily available for average schools in many countries. This article presents a spectrometer developed by one of the authors to make spectrometric analysis affordable to every secondary school. The project website details several school experiments in spectrometry, and the laboratory protocol for one experiment is included in the article.
I would recommend this article for introducing analytical chemistry in science lessons (not only chemistry, but also biology and environmental science), particularly for secondary schools that do not have a well-equipped laboratory. The proposed approach is simple and friendly enough to encourage teachers and students to try the suggested experiments and to explore new ones.
Teachers could use the article for a discussion of the methodology of spectrometry and the theory of spectrometric measurements. The experimental analysis provides the opportunity to analyse the obtained data mathematically, thus linking chemistry and statistics.
The article could also be used for a comprehension exercise. For example:
- Given the procedure for making the calibration curve from the stock standard solution, complete the following table:
| Flask | A | B | C | D | E |
|---|---|---|---|---|---|
| Volume of standard glucose solution (ml) | 2 | 3 | 6 | 8 | 10 |
| Volume of distilled water (ml) | 98 | 97 | 94 | ||
| Glucose concentration (mg/ml) | 0.3 | 1.2 | 1.5 |
Giulia Realdon, Italy