

Supporting materials
Download
Download this article as a PDF


This activity was presented at the Science on Stage Festival 2024. ![]()
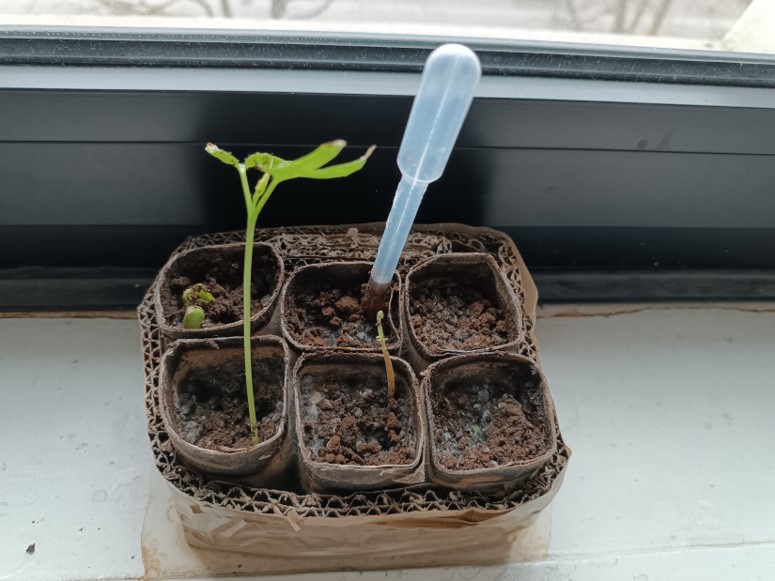
Circle of life: explore sustainability, the circular economy, and chemical analysis by evaluating coffee waste as a potential soil enhancer.
The “A Cup of Coffee” project, carried out by secondary school students aged 16–18 in Italy, introduces sustainability and circular economy[1] concepts through engaging STEM activities. This initiative demonstrates how coffee grounds, often discarded as waste, can become a valuable resource.[2,3] By turning classroom learning into an environmental challenge, students gain practical insights into waste recovery and energy production.
The project started with an analysis of the coffee waste produced at school. Students interviewed the school’s barista and calculated the daily and annual amounts of coffee grounds generated. Using this data, they explored two main investigative paths:
In this article, we focus on the first point, namely, the laboratory activities that are used to determine the nitrogen, phosphorus, and potassium contents.
Age Range: 14-16; 16–18 years
Curriculum Topics: Sustainability, chemistry, biology, environmental science, circular economy, and renewable energy. Chemistry topics covered include redox reactions, periodic table groups, elements vs compound, organic vs inorganic compounds, acid-base reactions, colorimetric analysis, flame tests, and stoichiometry calculations.
Coffee grounds are part of a much larger problem that begins with the entire coffee production cycle, from picking the cherries to processing and roasting the beans to their use.[2,3] In this article, we have chosen to focus exclusively on the final stage of the cycle: what happens to the grounds after the coffee is brewed?
Plants need certain key elements to grow, and if the soil doesn’t have enough of them, fertilizers can be used to improve growth, in particular, nitrogen, phosphorus, and potassium.[4] Are these elements present in coffee grounds? If so, could they be recycled to make fertilizer?[5]
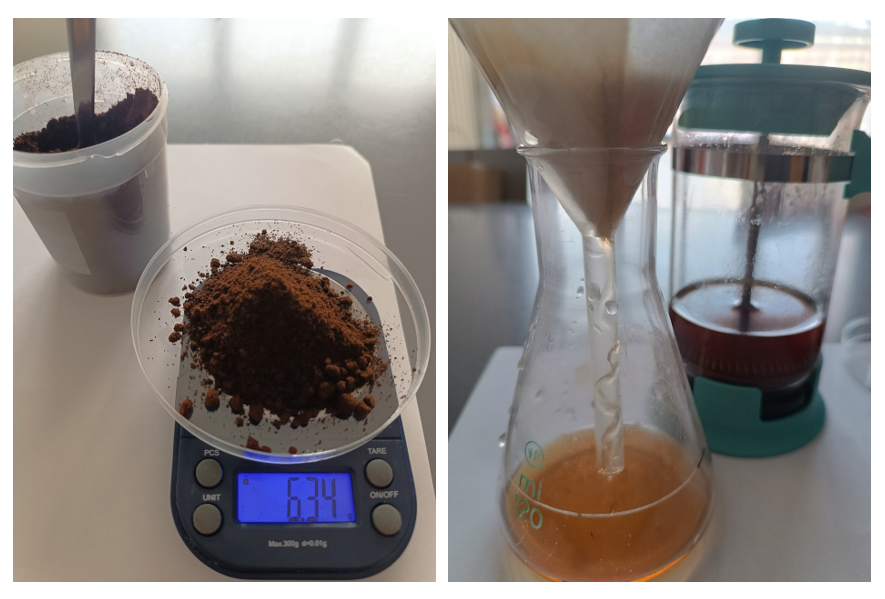
The first step is to introduce students to the theme and explain the task of testing coffee grounds to determine whether they contain the essential elements required for use as a plant fertilizer. The coffee grounds must also be dried for use in the rest of the activities. Since this drying process can take some time, it should be started several days, at least, before the lesson.
The water content is determined by drying the coffee sample in an oven at 105°C. By using this method, it is found that used coffee grounds contain approximately 58% water.
Before or after drying, or while waiting for the grounds to dry, the teacher can introduce the problem of coffee waste to students and discuss whether coffee waste could be a source of the components of fertilizers. The coffee waste, plant nutrients, and fertilizers infosheets can be used as a basis for the discussion. Students can also try the fertilizers crossword as a recap exercise.
Plants absorb nitrogen mainly in two forms: nitrate (NO₃−) and ammonium (NH₄⁺). These forms are created through natural processes like lightning, microbial action in the soil, and organic matter decomposition. In this activity, students perform simple tests to detect these two nitrogen species in coffee waste.
This activity involves detecting nitrogen in coffee grounds by producing ammonia gas through a chemical reaction. The activity takes about 30 minutes.
Handle NaOH (aq) with care, as it is caustic: wear protective gloves, lab coats, and eyewear.
Waste disposal: sodium hydroxide waste must be collected separately in a clearly labelled container (“Basic Waste – NaOH”). Do not pour concentrated NaOH down the sink. Neutralize small amounts carefully with a dilute acid (e.g., acetic acid or hydrochloric acid) before disposal according to local regulations.
Perform the activity in a well-ventilated area or in a fume hood to avoid inhaling fumes.
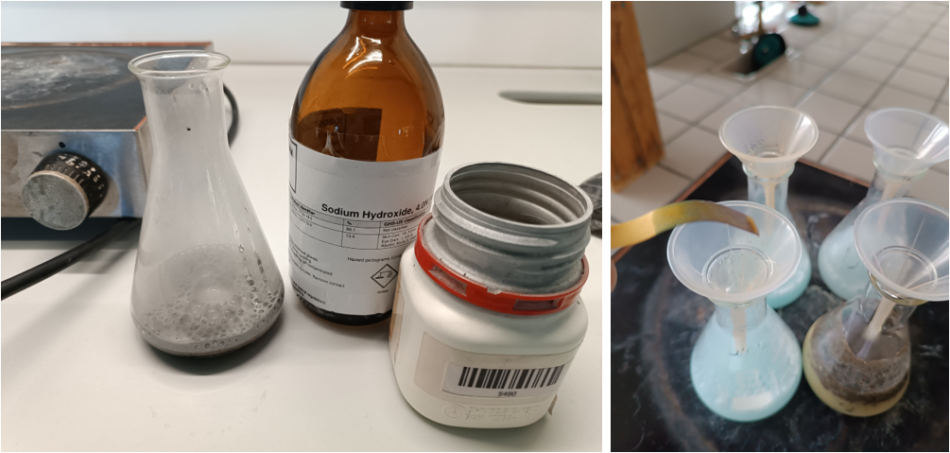
Why does ammonia indicate nitrogen content? When nitrate ions are reduced and ammonium ions are displaced, ammonia gas (NH3) is released. Since ammonia contains one nitrogen atom per molecule, detecting it confirms that nitrogen is present in the original sample.
To detect nitrogen in the form of nitrate (NO₃⁻), a redox reaction is used in a basic environment. In this reaction, the nitrate ion – where nitrogen has an oxidation state of +5 – is reduced to ammonia gas (NH₃), where nitrogen is in its lowest oxidation state (−3). This reaction is made possible by Devarda’s alloy, which contains strongly reducing metals like aluminium, zinc, and copper.
The overall redox reaction can be written as:
3NO3⁻ + 8Al + 21OH⁻ → 3NH₃ + 8AlO₃³⁻ + 6H₂O
To confirm the presence of ammonium ions (NH₄⁺) in a sample, a displacement reaction is performed. By adding a strong base, such as sodium hydroxide (NaOH), ammonia gas is released from the ammonium salt:
NH₄⁺ + OH⁻ → NH₃ (g) + H₂O
In both cases, a positive result is indicated by the production of ammonia gas, which is confirmed using litmus paper. When exposed to NH₃, the paper changes colour due to an acid–base reaction – typically turning from red to blue, indicating the basic nature of ammonia.
In industry, similar chemical reactions are used in automated systems, such as Kjeldahl nitrogen analysis. These methods allow for fast, large-scale determination of nitrogen content in organic waste, supporting fertilizer production and nutrient recycling.
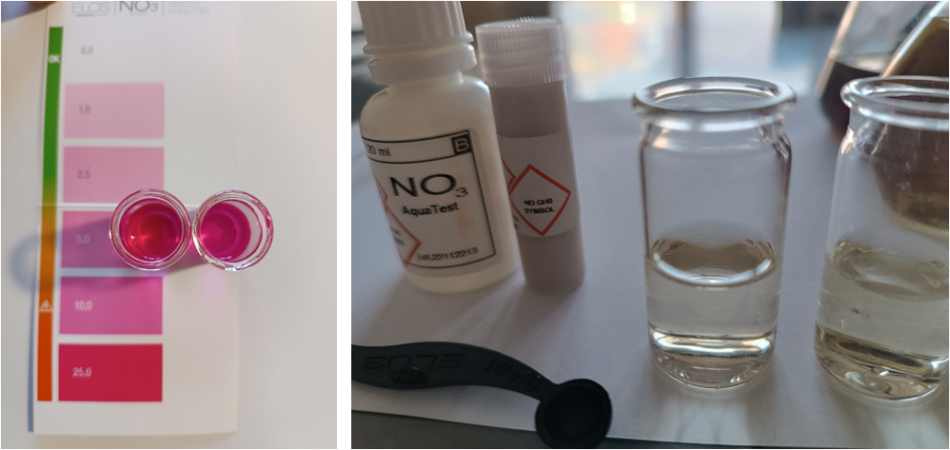
This experiment helps to determine the presence of nitrates in coffee waste. Nitrates are essential nutrients for plants but can cause water pollution in high concentrations. Using an aquarium test kit, students can measure nitrate concentration (range 1–25 mg/l). This method provides a simple and accurate way to analyze nitrates, making it useful for environmental monitoring and agricultural applications. This activity takes about 15–20 minutes.
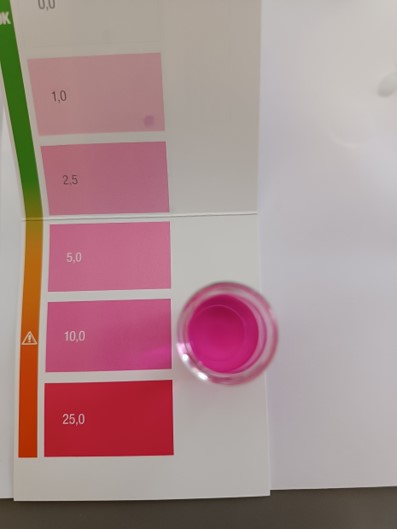
Have students answer the questions on the nitrate worksheet to put their readout in context. Worked examples can found on the nitrate answers sheet.
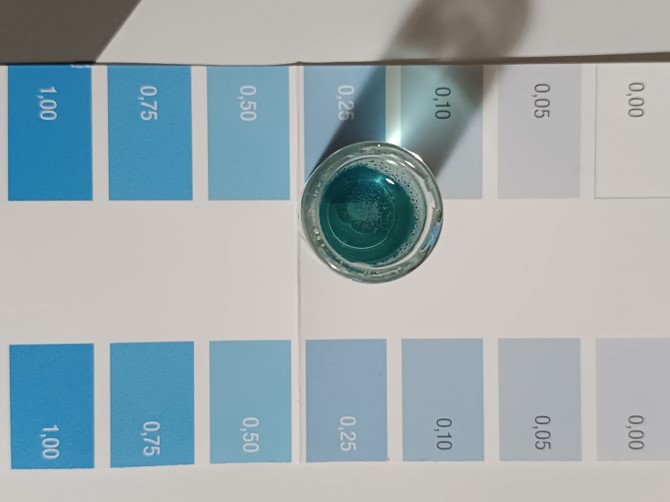
Phosphates, just like nitrates, are essential nutrients for plants and can behave in the same way in terms of environmental pollution. Plants take up phosphorus in the form of dihydrogen phosphate (H₂PO₄−) and monohydrogen phosphate (HPO₄²−) ions.
In this experiment, students use an aquarium test kit to measure phosphate concentration (range 0.05–1 mg/l) in coffee waste.
This activity takes about 15–20 minutes.
Follow the safety notes in the instructions for your test kit. Wear protective gloves and eyewear. Handle all reagents carefully, as some can cause burns. Keep reagents away from children and store them securely. Work in a well-ventilated area.
Have students answer the questions on the phosphate worksheet to put their readout in context. Worked examples can found on the phosphate answers sheet.
As an optional extension, phosphate levels can also be estimated using a more advanced UV/Vis spectrophotometric method.[6] A common approach involves the formation of a blue-coloured complex between orthophosphate ions and ammonium molybdate, followed by reduction with ascorbic acid. The intensity of the resulting blue colour is directly proportional to the phosphate concentration and is measured at specific wavelengths, typically around 890 nanometres. It is even possible to build simple spectrophotometers for this purpose.[7]
Potassium (K) is one of the three main nutrients that plants need to grow, along with nitrogen (N) and phosphorus (P). Unlike nitrogen or phosphorus, potassium does not become part of the plant’s cells or structures.
In this activity, students test for the presence of potassium in coffee waste ash using a flame test.
This activity takes about 20 minutes (for the simple activity with a Bunsen burner and cobalt blue glass) or 2 hours if building a DIY spectroscope.
If both potassium and sodium are present, a blue filter (such as cobalt glass) is needed to block the strong yellow light from sodium and allow the red–violet light from potassium to be seen more easily.
Even better, you can observe the potassium emission line using a hand spectroscope. If you don’t have one, you can build your own using a CD[8] or construct a DIY smartphone spectroscope.[9] A smartphone camera may not detect infrared, but it is possible to see the red/violet line, depending on the device’s sensor.
The potassium emission line appears as a weak violet or red line in the near infrared, around 766 nanometres. Because of its position in the spectrum and possible interference from other emissions, such as sodium, it can be difficult to observe. The setting must be dark, and spectroscopes (if used) must be well calibrated.

Handle HCl (aq) with care, as it is corrosive: wear protective gloves, safety goggles, and a lab coat and use only in a well-ventilated area or fume hood.
Disposal instructions: do not pour concentrated HCl down the sink. Neutralize with a dilute sodium bicarbonate solution in a fume hood. Dispose of neutralized solution according to your local hazardous waste regulations.
Use a Bunsen burner with caution: keep it away from flammable materials, never leave it unattended, and always use a blue flame for best results and safety.
Be careful with hot nickel wire. Use pliers or tongs and allow it to cool before touching. Clean it between tests with dilute HCl and a flame.
A red–violet-coloured flame or the near-infrared emission line confirms the presence of potassium.
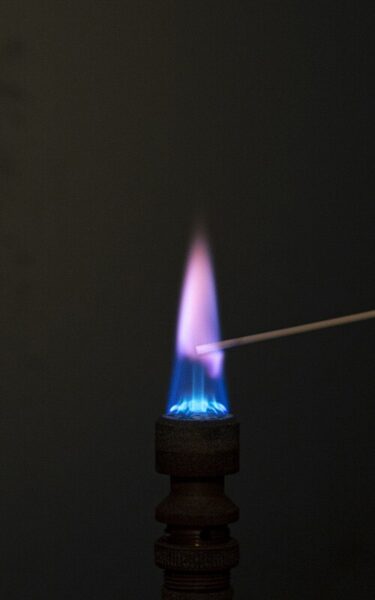
Flame tests are based on the property of some elements emitting visible light when they are excited by absorbing energy from the flame. The excited electron quickly returns to its ground state and releases energy as light of a specific colour.
Ask students why the cobalt blue glass helps when observing the potassium flame.
Answer: cobalt blue glass acts as a filter that absorbs the intense yellow light emitted by sodium, which is often present as a contaminant. This makes it easier to see the faint violet flame of potassium, which would otherwise be masked by sodium’s brightness.
Potassium levels could also be estimated simply through atomic absorption spectrophotometry with a spectrometer.[10]
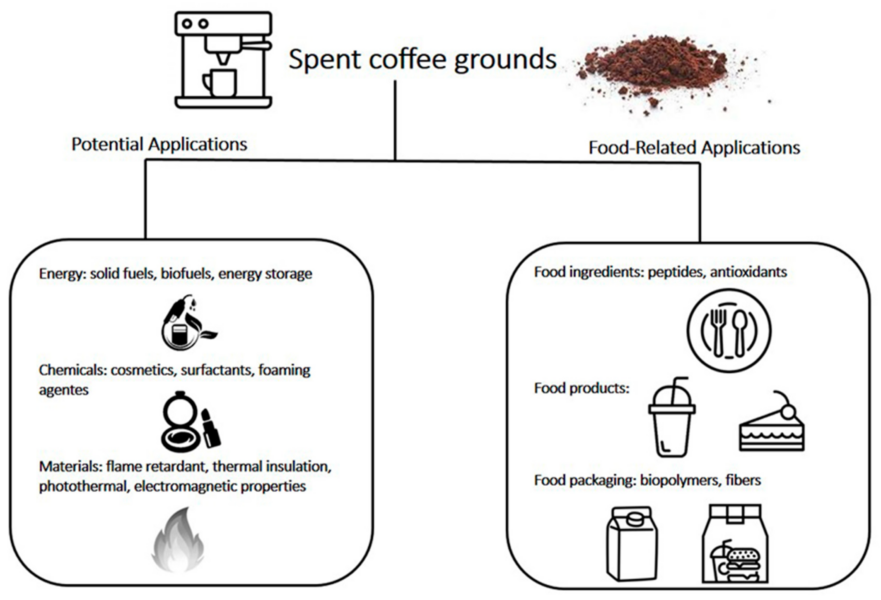
These results can act as a springboard for an interdisciplinary project on coffee waste. Encourage students to research the problem of coffee waste. By adopting circular economy practices, the coffee sector can transform this waste into valuable resources. For example, coffee residues can be used to produce biogas, fertilizers, compost, biofuels, and even materials like biochar and packaging materials.[11,12]
To share their findings, students can make posters and videos, engaging both their peers and the wider community to promote awareness of sustainability and encourage practical waste-recovery initiatives, aligning with sustainable development goals on responsible consumption and climate action. The project has potential for further expansion. You can use some of the suggested resources to learn more about some aspects of fertilizers. Schools could introduce composting initiatives to make compost from the coffee waste, providing additional hands-on STEM learning opportunities. Students might also investigate the effects of coffee grounds on different soil types, thereby encouraging interdisciplinary collaboration and deeper inquiry.
[1] The EU’s new circular economy action plan: https://environment.ec.europa.eu/strategy/circular-economy-action-plan_en
[2] International Coffee Organization (2023) Coffee Development Report 2022–23: beyond coffee – towards a circular coffee economy. pp 71–74.
[3] Rockström J et al. (2009) A safe operating space for humanity. Nature 461: 472–477. doi: 10.1038/461472a
[4] Information on nutritional requirements for plants: https://openstax.org/books/biology-2e/pages/31-1-nutritional-requirements-of-plants
[5] Kasongo RK et al. (2011) Coffee waste as an alternative fertilizer with soil improving properties for sandy soils in humid tropical environments. Soil Use and Management 27: 94–102. doi: 10.1111/j.1475-2743.2010.00316.x
[6] Habibah, N et al. (2018). A simple spectrophotometric method for the quantitative analysis of phosphate in the water samples. Jurnal Sains dan Teknologi 7: 198–205. doi: 10.23887/jstundiksha.v7i2.13940
[7] Thal MA, Samide MJ (2001) Applied electronics: construction of a simple spectrophotometer. Journal of Chemical Education 78: 1510 – 1512. doi: 10.1021/ed078p1510
[8] Instructions on how to build a DIY low-cost spectrometer: https://www.instructables.com/DIY-Low-Cost-Spectrometer/
[9] Instructions on how to build a smartphone spectroscope: https://astro3d.org.au/education-and-outreach/diy-smartphone-spectroscope/
[10] Bastién N et al. (2014) Camping burner-based flame emission spectrometer for classroom demonstrations. Journal of Chemical Education 91: 1655–1660. doi:
10.1021/ed4008149
[11] Franca AS, Oliveira LS (2022) Potential uses of spent coffee grounds in the food industry. Foods 11: 2064. doi: 10.3390/foods11142064
[12] Pongsiriyakul K et al. (2024) Upcycling coffee waste: key industrial activities for advancing circular economy and overcoming commercialization challenges. Processes 12: 2851. doi: 10.3390/pr12122851
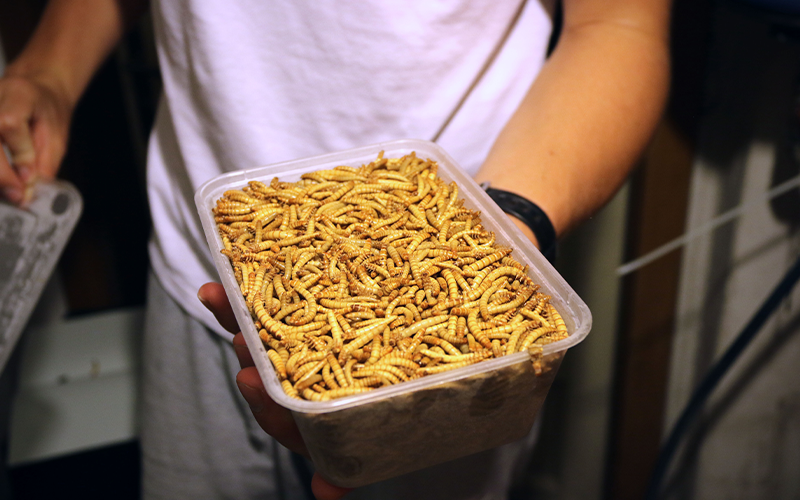
Mealworms are insects with a high nutritional value and could provide a source of animal protein that is more sustainable than traditional livestock.


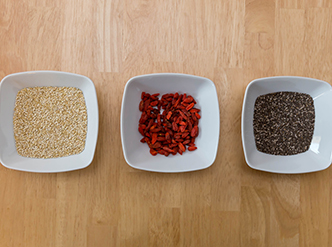
Are you tempted to buy ‘superfoods’ for health reasons, despite the higher prices? These activities encourage students to explore some of the…


Spinning a yarn: explore the chemistry of wool and use it as a raw material for biobased products through simple hand-on activities.