Supporting materials
Download
Download this article as a PDF


Exploring visual acuity requires not only biological experiments, but also some understanding of the underlying physics.
Visual acuity is a measure of how sharp our vision is, particularly how well we can resolve small details. Opticians assess this by asking us to read from a wall chart until the letters become too small for us to make out clearly.
One of the biological factors that determines visual acuity is the density of the photoreceptor cells in the retina (see box ‘How our eyes work’ below). This prompts an intriguing question: could increasing the density of receptors in the retina make our vision sharper? To answer this question, we need to consider both the biology of the visual system and the physics of light. These topics are part of most secondary-level biology and physics curricula. However, they are traditionally taught separately, often to different groups of students. In contrast, the cross-curricular approach proposed here will enable students to gain a deeper understanding of both the biology and physics of visual acuity and will convey an important general message: many problems in modern science can best be solved through teamwork and interdisciplinary collaboration.
This article describes a simple way of assessing visual acuity by creating a wall chart and using it to calculate eye resolution. This method can then be used to estimate the smallest distance on the retina at which the images of two points can be identified as two distinctly separate objects. A follow-up experiment, available in the additional materials, relates this distance to the theoretical limits of visual acuity based on the physical properties of light.
The two activities are most appropriate for students aged 16-19 years and will take about two hours each, including the preparation and data analysis. Another two hours should be allowed for the discussion of the results.
Light rays reflected by objects enter the eye via the pupil. Four components of the eye – the cornea, lens, aqueous humour and vitreous humour – focus the light rays on the retina, the surface of the back of the eyeball (figure 1). The retina is organised in different layers, one of which is made up of millions of light-sensing photoreceptors that pass signals to the brain via other cells such as the ganglion cells. The photoreceptor cells are specialised nerve cells and come in two types – rods and cones (named for their shape). Cones, found mainly in the centre of the retina, enable sharp colour vision in bright light. Rods, found towards the edges of the retina, help us to detect motion and to see in dim light, and allow peripheral vision. The density of photoreceptors in the retina (which can be over 200 000 cells per square millimetre in the fovea centralis) plays an important role in visual acuity.

The angular resolution of the human eye is a measure of the smallest angle between two points that are perceived as distinctly separate and is related in part to the density of photoreceptors on the retina. It is typically around 1 arcminute (1/60th of a degree). In this activity, angular resolution is calculated by determining the ratio of the distance between the two points and the distance between the observer and the points. This simplified mathematical procedure (which replaces the more complicated calculation of the tangent of the angle α in figure 2) is possible because the angular resolution assumes very small values. In mathematics, this shortcut is known as the small-angle approximation. The calculated ratio can then be used to estimate the distance between these two points projected onto the retina, as shown in figure 2.
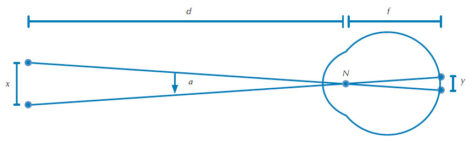 Figure 2: The reduced eye. This simplified model of the ocular system of the human eye approximately matches the ocular dimensions of the real eye, but combines the refractive bodies of the cornea, lens, aqueous humour and vitreous humour into one, assuming a uniform index of refraction.
The students will create a chart with simple black lines separated by gaps of varying width. They will then be asked to state which lines are perceived as separate and which appear to be merged, and to use these results to calculate an estimate of the angular resolution and thus the spacing between the receptors in the eye.


The angular resolution of the human eye typically ranges between 40 arcseconds and 1 arcminute. To perceive two separate points, at least three photoreceptors arranged in a row are required: one to receive light from each of the points, and one for the gap in between the points. For an angular resolution of 1 arcminute (which corresponds to 0.3 m at a distance of 1 km), the images on the retina are separated by approximately 6 μm, meaning the centre-to-centre distance between two neighbouring receptors is 3 μm. At an angular resolution of 40 arcseconds, the distance between the imaged points is approximately 4 μm.
The actual resolution of the eye is affected not only by photoreceptor spacing, but also by the diffraction of light as it passes through the pupil. You can explore this further by downloading experiment 2.
So, could visual acuity be improved by increasing the density of the cones in the retina?
An angular resolution of 40 arcseconds to 1 arcminute is achieved only when we look fixedly at an object. The image of the object is then projected onto a specific part in the centre of the retina, the fovea centralis, which contains only cone photoreceptors. The density of cones in the fovea is much higher than anywhere else in the retina, and the cones here have a diameter of only 3 μm (compared to up to 10 μm in other areas of the retina). Allowing for some extracellular space around each cone (e.g. for transport of nutrients), the centre-to-centre distance between the cones in the fovea is about 4 μm. Thus the density of the cones in the fovea is already very close to the maximum packing density possible.
As can be explored in the follow-up experiment, light diffraction in the eye means the minimum resolvable distance between two points of light is about 5 μm, giving a minimum predicted distance between cones of approximately 2.5 μm. Allowing for some extracellular space between the cones, this theoretically predicted distance is in excellent agreement with the actual distance between the cone receptors in the fovea centralis of approximately 4 μm. Therefore a further increase in the density of cones might not be possible on biological grounds and, based on physical limitations determined by the properties of light, would not lead to any significant gain in visual acuity.
This article describes two experiments related to visual acuity, an example of the numerous links between biology and physics that can be found in nature. Cross-curricular activities can make science more appealing and can offer a great opportunity to collaborate with other teachers.
All the materials required for the experiments are readily available and the instructions are easy to follow, making the activities suitable for students to perform in small groups.
The text could be used as a starting point for discussing the importance of the teamwork and interdisciplinary collaboration to solve many problems in modern science and also in other subjects.
Mireia Güell, Spain
Download this article as a PDF