


Evolution in action: pathogens Understand article
Pathogens that threaten human health are constantly evolving to keep ahead of our defences. But we can now track these changes at the genetic level, even as they are happening.
One of the main driving forces of evolution is natural selection – where individual organisms with a particular genetic makeup produce more offspring than others in a given environment, leading to adaptations in that organism that allow it to survive, while others perish.

Science Photo Library/De Angelis, Maurizio
As Darwin established, this process of positive natural selection – whereby traits that increase an organism’s ‘fitness’ become dominant in a population – contributes to the diversity we see in living species. But it is also a factor in processes that endanger our own survival, such as the spread of viral infections and the emergence of antibiotic resistance in bacterial pathogens. However, thanks to ingenious laboratory experiments (see, for example, Bryk, 2017), and advances in gene sequencing technology, such as hand-held sequencing machines, we can now track this process quickly and precisely – not only in the laboratory, but just about anywhere in the world. This has proved hugely valuable for understanding the evolution of disease-causing micro-organisms.
In this article, we focus on two remarkable studies that look closely at how such pathogens are constantly evolving, revealing the patterns of genetic change – and limiting factors – behind this process.
Antibiotic resistance under the spotlight
A textbook example of evolution by positive natural selection is the emergence of antibiotic resistance in bacteria. The use of antibiotics applies a selective pressure to a population of bacteria, which mutate and reproduce very quickly. As a result, any genetic variants that protect bacteria from the antibiotic remain in the population, and all the other variants will disappear.
This process has been dramatically caught on camera by Dr Michael Baym, a researcher at Harvard University, USA, and a self-professed antibiotic resistance fighter. In 2015, Baym set up a clever contraption to visualise how resistant bacteria spread in an environment with antibiotics. He used a giant rectangular Petri dish, 60 cm wide by120 cm long (a standard Petri dish is 9 cm in diameter) filled with agar, a jelly-like medium for growing bacteria, which had been dyed black. Crucially, he infused the agar with concentrations of antibiotic that increased in steps along the length of the dish (figure 1), from zero antibiotic at the ends to 1000 units of antibiotic in the centre sections – which should be enough to kill any bacteria outright. He set up a spotlight and camera over the dish, so that any colonies of bacteria would be clearly visible as white spots against the background of the black agar. Then, he inoculated the plate with Escherichia coli (E. coli ) bacteria at the very ends of the dish, where no antibiotic was present – and waited for the process to begin (figure 2).

Kishony Lab, Harvard Medical School and Technion – Israel Institute of Technology
So, what happened? The E. coli could move within the top layer of the agar, so when the bacteria ran out of food in their own neighbourhood, they moved on to another region (figure 3). Their growth, however, was inhibited by the antibiotic in the neighbouring area, so that only bacteria with mutations allowing them to survive this exposure could spread further. So the first region containing antibiotic (in a concentration of just one unit) was invaded initially by single mutants. These reproduced, with their progeny fanning out over the entire region – until they themselves encountered the next region with a higher concentration of antibiotic. At the boundary, the bacteria paused again until new mutations providing increased tolerance to the antibiotic emerged.
This process was repeated at each boundary until, after 11 days of bacterial growth, E. coli bacteria covered the entire surface of the giant dish, with the bacteria in the centre of the dish having evolved resistance to antibiotic concentrations 1000 times higher than those near the edges (figure 4). Each step in this process was captured on a now-famous videow1.

Kishony Lab, Harvard Medical School and Technion – Israel Institute of Technology

Kishony Lab, Harvard Medical School and Technion – Israel Institute of Technology

of antibiotic 1000 times higher than in figure 3.
Kishony Lab, Harvard Medical School and Technion – Israel Institute of Technology
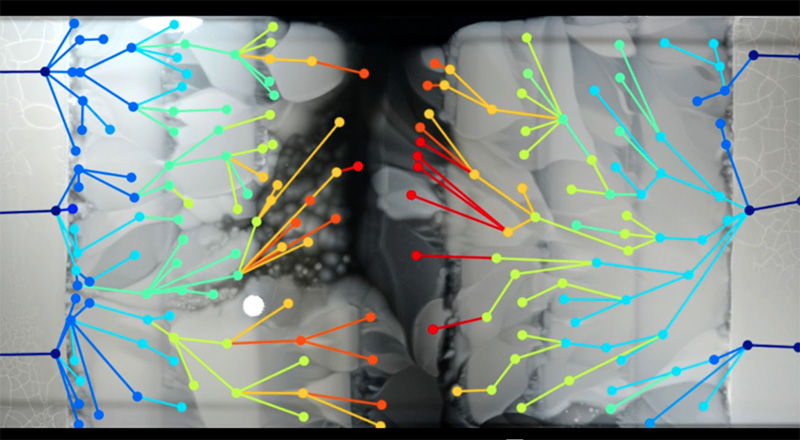
As the researchers could see the spread of bacteria frame by frame, they could also sample bacteria from critical points where particular mutants originated. By sequencing these genomes, they were able to pinpoint the changes in each step on the evolution of the resistance (figure 5).
It turned out that many of the mutations occurred multiple times, so it seems that some paths to resistance are more common than others. In addition, some mutations occurred in genes that apparently had nothing to do with the antibiotic, which illustrated an important point in the development of resistance: the need to adapt to the antibiotic is a burden on basic metabolic processes, so in the absence of antibiotics, resistant bacteria often grow more slowly than the non-resistant ones. The extra mutations were needed to compensate for the metabolic burden, and this may be another reason for the pause of growth at the boundaries where the antibiotic concentration increased.
Kishony Lab, Harvard Medical School and Technion – Israel Institute of Technology
In a further step in this experiment, Baym and his colleagues made another crucial observation. If they made the difference between antibiotic concentrations in neighbouring regions much larger, no mutants could survive in the next region, and bacterial growth stopped completely at the first boundary. This phenomenon can be explained by the same principle: when the selective pressure of antibiotics in the environment is really high, it is nearly impossible for bacteria to grow at all, because the mechanisms needed to overcome such a burden require too many mutations at once – so the bacteria die.
The Ebola epidemic
Another example of the evolution of microbial pathogens that has been intensively studied is one of the deadliest human pathogens: the Ebola virus. The 2013–2015 Ebola epidemic was the longest and largest so far, with 28 646 cases and 11 323 deaths recorded by June 2016. The duration of the epidemic, coupled with the arrival of rapid gene-sequencing technology that could be deployed in the field, allowed researchers to trace the evolution of this virus as it was infecting new patients.
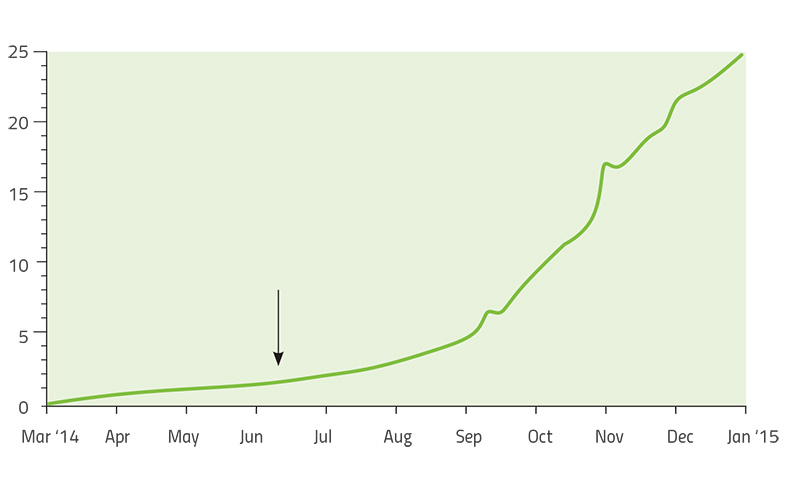
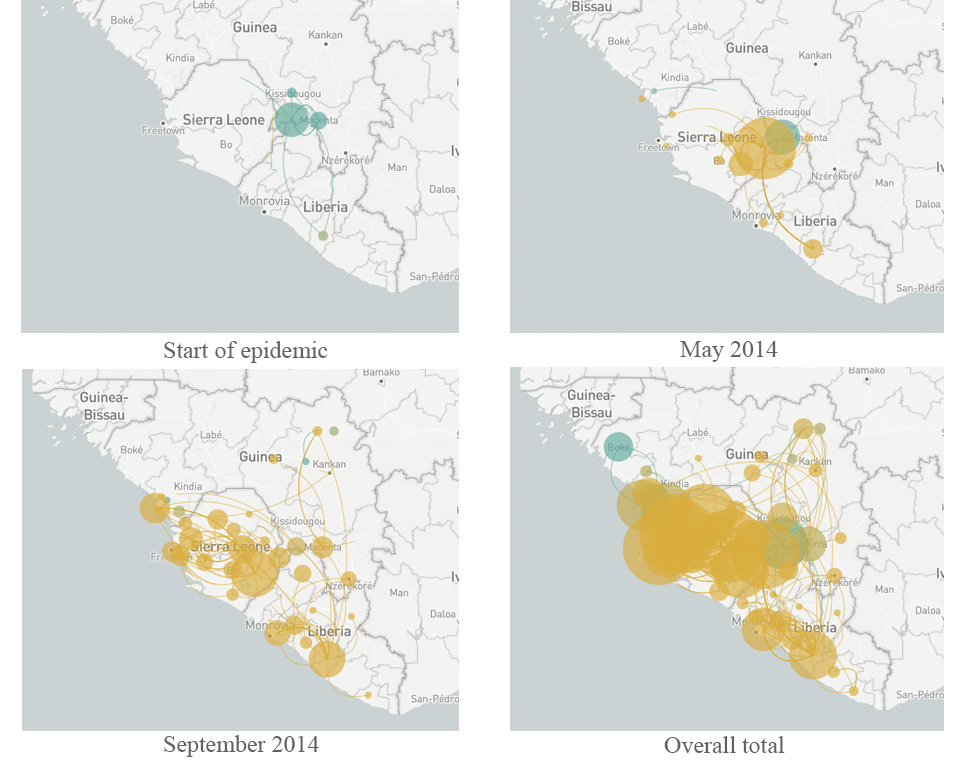
Led by US-based geneticists Dr Pardis Sabeti (Harvard University), Dr Jeremy Luban (University of Massachusetts Medical School) and Dr Andrew Rambaut (University of Edinburgh), the scientists studying Ebola constructed a ‘family tree’ of the virus as it spread through West Africa over two years (Park, 2015). Each branch of the tree represented a new set of mutations that allowed the virus to grow and multiply better than other strains. By comparing viral genomes collected from patients in different countries and at different times, the team established that the main variant of the virus originated in Guinea – and that it was able to spread further only after it had acquired five new mutations. As it moved from Guinea into Sierra Leone in May 2014, another mutation appeared and became much more common in that region (Diehl et al., 2016)w2. The new mutation was first observed in just a single patient, but it was so successful that 97% of the 200-plus Ebola genomes analysed in the whole study were descendants of that mutant. This is a remarkable success story of a strain that had emerged only two years before (figure 6).
More importantly, the study revealed some genes in the Ebola genome that had changed much more than expected, including those for protein molecules located on the outside of the virus. These viral proteins are thought to be a target for human antibodies that fight the infection, so rapid changes in these proteins will help the virus to avoid neutralisation by the host – a pattern that is therefore driven by natural selection. These genes have now become a promising focus for research to counter the spread of the virus in any future epidemic. Finding out more about the mechanisms of evolution is also helping researchers to develop effective strategies to combat pathogens in the future.
References
- Bryk J (2017) Evolution in action: the 67 000-generation experiment. Science in School 41: 24-29.
- Park D et al. (2015) Ebola virus epidemiology, transmission, and evolution during seven months in Sierra Leone. Cell 161 1516-1526. doi: 10.1016/j.cell.2015.06.007
- Diehl W E et al. (2016) Ebola virus glycoprotein with increased infectivity dominated the 2013–2016 epidemic. Cell 167 1088–1097. doi: 10.1016/j.cell.2016.10.014
Web References
- w1 – Watch the video created by Michael Baym and colleagues showing E. coli spreading through regions of increasing antibiotic concentrations on the ‘mega-plate’.
- w2 – Watch an animation showing the spread of the Ebola virus, and how the new strain that emerged around June 2014 affected this.
Resources
- Visit The Atlantic website for an accessible article on the Baym experiment and its implications.
- Read the scientific paper in the journal Science reporting the Baym experiment:
- Baym M et al. (2016) Spatiotemporal microbial evolution on antibiotic landscapes. Science 53: 1147-1151. doi: 10.1126/science.aag0822
- Watch researcher Pardis Sabeti’s TED talk about fighting Ebola.
- Read a blog post about the Ebola surveillance work, with links to media coverage of the research and technology behind it.
- A guide to Ebola can be found on the Médecins Sans Frontières website.
Review
One of the main problems in teaching evolution is the dimension of time. Because human life is short compared to the timeframes in which the great evolutionary processes take place, the concept of change over time is a basic difficulty in understanding evolution. So, examples of evolutionary processes that take place over a period compatible with human perception provide opportunities to overcome these problems.
The experiment described in this article offers a very good view of how the elements of time and mutations affect evolution. Teachers could use this article to teach evolution, by demonstrating that evolution can take place over a short period. The article is also helpful in explaining the central role of mutations during evolution, as a source of diversity that is then acted on by natural selection. And because the experiment involves a familiar idea – the use of antibiotics – it is easy to understand.
Panagiotis K Stasinakis, Biology teacher, 4th High School of Zografou, Greece