


Using biological databases to teach evolution and biochemistry Teach article
Online tools can be used to compare the sequences of proteins and understand how different organisms have evolved.
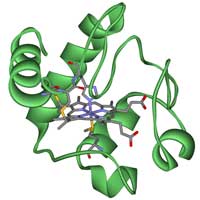
Cytochrome c.
Image courtesy of Klaus
Hoffmeier/ Wikimedia
commons
In the past, scientists carried out evolutionary analyses by comparing the physical characteristics of species – known as their phenotypes – found in fossil records. Since the discovery of the molecular clock, however, all this has changed.
The concept of the molecular clock emerged from the observation that the longer the time since two species diverged from a common ancestor, the more different their DNA or proteins sequences will be (for a review, see Bromham & Penny, 2003).
By comparing homologous gene or protein sequences – in other words, those from two organisms with a common ancestor – you can measure how long it has been since the organisms diverged. This can be visualised in a phylogenetic tree.
To examine how similar two genes are, you need to have their sequences and align them correctly (Kozlowski, 2010). Getting those sequences used to be really difficult, but not anymore.
Your students have probably told you that everything is on the Internet – this time, they’re right. There are many examples of freely accessible biological databases containing real research data on the Internet, but for this activity we are going to use two resources in particular.
The National Center for Biotechnology Information (NCBI)w1 in Bethesda, MD, USA, provides access to bio- medical and genomic information, whereas the European Bioinformatics Institute (EBI)w2, located in Hinxton, UK, provides freely available data from life science experiments and performs basic research in computational biology. The NCBI database will provide you with the sequence of any gene or protein that has already been sequenced, and then you can use tools from the EBI to align the sequences and analyse them.
Activity
When investigating evolutionary relationships between different organisms, it is important to choose carefully which gene or protein you will use. There are some well-known homologous genes that can be used, such as those for the proteins hemoglobin or cytochrome c, and in this activity we will use the latter. Cytochrome c is a small heme protein that is a central component of the electron transport chain in mitochondria. All aerobic organisms have evolved from a common ancestor that first used cytochrome c, so it is a good choice for our purposesw3.
This activity is carried out in three different sections:
- finding the amino acid sequence of cytochrome c in different organisms,
- aligning them, and
- making a phylogenetic tree.
Finally, some questions are included to guide the investigation of evolutionary relationships.
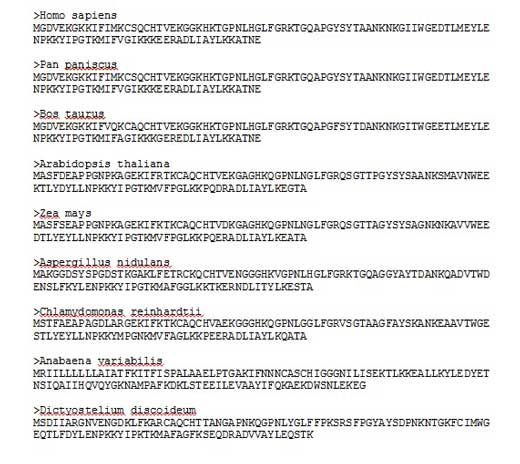
Finding protein sequences
- Go to the NCBI webpagew1.
- In the search area at the top of the page, select ‘protein’ in the drop- down menu.
- Type the name of a species, e.g. Homo sapiens, and cytochrome c.
- Click the search button.
- A new page will list your search results. Most of them are the same sequence from different sources, but others can be partial sequences or belong to a different species or protein. Carefully choose the correct protein of interest and click on the link underneath labelled ‘FASTA’.
- From the new page that loads, copy the string of capital letters denoting the sequence of amino acids. Paste the letters into a Word document, remember to label the sequence with the name of the organism it comes from.
- Do the same for as many organisms as you desire, depending on what you want to investigate with your students. You may include different primates to see how humans evolved or organisms from the five traditional kingdoms to see how life in general evolved. In this activity, 3 animals, 2 plants, 2 algae, a fungus and a protozoan will be used.
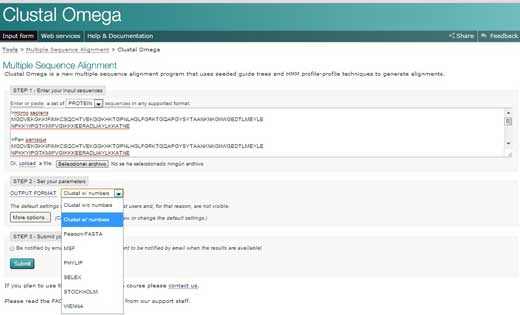
Aligning sequences
- Go to the European Bioinformatics Institute (EBI) websitew2 and click on ’Services’. Then choose ‘proteins’.
- Click on Clustal Omega. Copy the text from your Word document and paste it into the text box labelled ‘STEP 1’.
- In STEP 2, choose a format for the alignment output, such as ‘Clustal w/ numbers’ which will show the length of each sequence. Finally, click on ‘Submit’ to complete STEP 3.
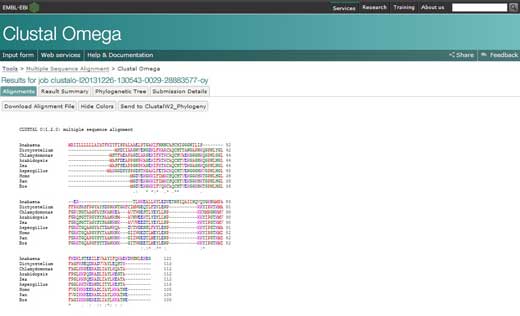
- The alignments for the multiple sequences will appear in a new window. The first thing you can do is click to show colours. This option will give the same colour to each amino acid, so it is easier to identify them.
- To analyse the alignment, keep the following symbols in mind: an asterisk (*) means that the sequences are identical at that position; a colon (:) indicates conserved substitutions (same colour group); and a period (.) refers to semi- conserved substitution (similar shapes). Colours group the amino acids by characteristics. Red are small, hydrophobic, aromatic; blue are acidic; magenta are basic; green are hydroxyl, amine, amide, basic; and gray are the rest.
- If you click on the option ‘Result Summary’, you can see the percentage of identity conserved between the different organisms after the alignment. In this matrix, you can find out the percentage identity of two organisms for the sequence of protein cytochrome c. In addition, if you have Java™ installed in your computer, you can use Jalview, a free program for multiple sequence alignment editing, visualisation and analysis. With Jalview, you will be able to see the consensus sequence for cytochrome c and the level of con- servation for the different amino acids.
Clustal Omega software has many different options that involve more sophisticated mathematical knowledge than is necessary for our purposes. If you want to know more about the use of Clustal Omega, see the article by Sievers et al. (2011)
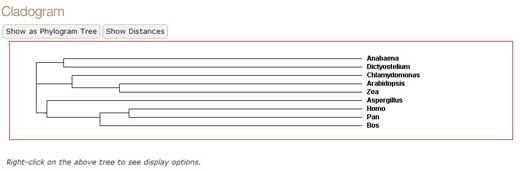
Making a Phylogenetic tree
- In the Clustal Omega results, click on ‘Phylogenetic tree’ at the bottom (you will need to have Java™ installed).
- You can obtain a phylogenetic or cladogram tree. In a cladogram, the lengths of the branches in the tree are arbitrary, whereas in a phylogenetic tree, the lengths of the branches indicate how much the protein has evolved over time.
For further discussion
- Homologous molecules are an example of divergent evolution. How can you explain divergent evolution using cytochrome c?
- Alignments can be made using nucleotide (genes) or amino acids (protein) sequences. Why do you think it is more useful to use protein rather than DNA in order to analyse evolutionary relationships?
- In phylogenetic trees, a ‘clade’ is formed by all organisms that have a common ancestor. Give an example from your cladogram.
- What organisms have suffered a speciation event more recently, according to phylogenetic analyses of cytochrome c? What is the total number of speciation events?
- Why do you think some amino acids have changed due to mutation but not others? Do you think that conserved amino acids have not changed because their codons have not undergone any mutations at all?
- Show some of these conserved amino acids in your alignment. Investigate their function on the Internet.
Glossary
Cladogram: A branched diagram that shows the evolutionary relationship between species, with arbitrary branch lengths.
Consensus sequence: A known set of conserved sequences, or the calculated order of the most frequent amino acids found at each position in a sequence alignment.
Conserved amino acid: A sequence of amino acids in a polypeptide that is similar across multiple organisms.
FASTA: a text-based format for representing nucleotide or peptide sequences using single-letter codes. A sequence in FASTA format begins with a single-line description, followed by lines of sequence data. The description line is distinguished from the sequence data by a greater-than (>) symbol.
Homologous protein: Those proteins shared by some organisms that are derived from a common ancestor.
Phylogenetic tree: A branched diagram that shows the evolutionary relationship between species, where branch lengths indicate the difference between the two proteins or genes.
Speciation event: The moment at which an ancestral species diverge into new species.
Acknowledgements
The author would like to thank his colleague María Isern for help with revising the English grammar in the article.
References
- Bromhan L. Penny D. (2003) The modern molecular clock. Nature Reviews Genetics 5: 216-224
- Kozlowski C. (2010) Bioinformatics with pen and paper: building a phylogenetic tree. Science in School 17: 28-33.
- Sievers F. et al. (2011) Fast, scalable generation of high-quality protein multiple sequence alignments using Clustal Omega. Molecular Systems Biology 7: 539
- This article is freely available from the Molecular Systems Biology website.
Web References
- w1 – The US National Center for Biotechnology Information provides access to biomedical and genomic information.
- w2 – The European Bioinformatics Institute provides freely available data from life science experiments, performs basic research in computational biology and offers an extensive user training programme, supporting researchers in academia and industry.
- w3 – John Kimball has written an online biology textbook called ‘Taxonomy: Classifying Life’ that includes a chapter on ‘Phylogenetic trees’.
Resources
- The ‘Understanding Evolution’ website from the University of California’s Museum of Paleontology offers very good information about building and reading phylogenetic trees.
- To learn more about the use of cytochrome c in phylogenetic trees.
- The Protein Data Bank website in Europe belongs to the European Bioinformatics Institute and can be used for searching and viewing the 3D structure of cytochrome c.
- The Tree of Life website allows you to explore interactively and watch the Tree of Life television series that aired on the BBC with Sir David Attenborough.
Review
Biology teachers could use this article to link topics of evolution biology, history of science, biochemistry and genetics. To make the most of this article, it is important that students understand the fundamentals of DNA and protein biochemistry.
The activity described in the article is important for motivating students to work with autonomy in real research using scientific databases. Inside the classroom laboratory, students could be guided to work in small groups, comparing sequences of proteins, such as cytochrome c, or DNA, to understand the differences between phylogenetic and cladogram trees. Bioinformatics is very useful in the secondary school for carrying out ‘content and language integrated learning at different levels, with English, history and physics teachers in a interdisciplinary project. This article, which links these different subjects, could also open up discussions about the progress and limitations of such research.
Marina Minoli, Didactic Expert Agora University Centre, Italy