


Starlight inside a light bulb Teach article
Different stars shine with different colours, and you can use a light bulb to help explain why.
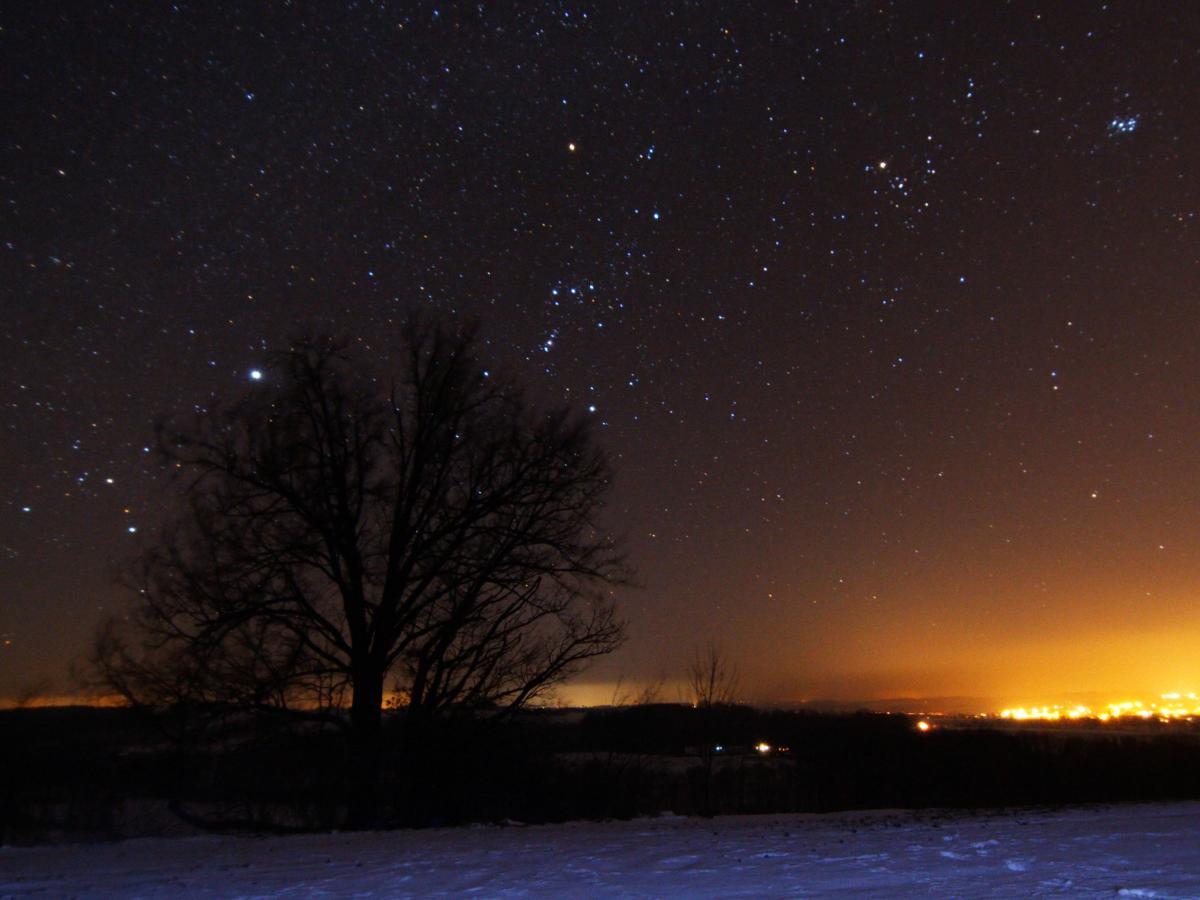
Orion
Image courtesy of H. Raab
After sunset, we can see thousands of stars as white dots across the night sky. They appear white because our eyes cannot usually detect the colour of such dim objects. However, if we look carefully at the brightest stars we can see that not all of them are white; they have different hues. And based on their colour alone, we can tell which stars are hotter and which ones are colder.
The brightest star seen from Earth – the Sun – is yellow, but stars have a range of colours. Near the Orion constellation, in the winter sky, some of the stars are bright enough to discern their hue (figure 1): white/blue (Sirius, above the tree on the left), blue (Rigel, above the tree on the right), and red/orange (Betelgeuse and Aldebaran at the top centre and right, respectively).
To understand the relationship between a star’s colour and its temperature, we need to observe an object close to us that, like the stars, shines because it’s hot: the filament of an incandescent lamp. The filament behaves like a black body, a subject studied by physicists that represents a milestone in the history of modern physics.
Black body radiation
By the late 19th century, scientists knew that bodies would glow when heated and that their colour would depend not on their material but on their temperature. But physicists could not find a model that described the radiation emitted by a black body, a perfect physical entity that reflects all the electromagnetic radiation that strikes it, regardless of its incoming direction or frequency.
The intensity and colour of the light emitted by a body could be explained by the Stefan–Boltzmann and Wien’s displacement laws, but a model that describes the spectrum emitted by a black body only appeared at the beginning of the 20th century. Published by the physicist Max Planck, it laid the foundations of quantum physics.
A black body emits a continuum spectrum of light, like those represented in figure 2. According to the Stefan–Boltzmann law (equation 1), the black body radiates energy at a rate that is proportional to the fourth power of its absolute temperature. In other words, the hotter the black body, the brighter it will shine:
P = AσT4 (1)
where P is the total power radiated by the black body, A its surface area, σ the Stefan–Boltzmann constant and T the absolute temperature.
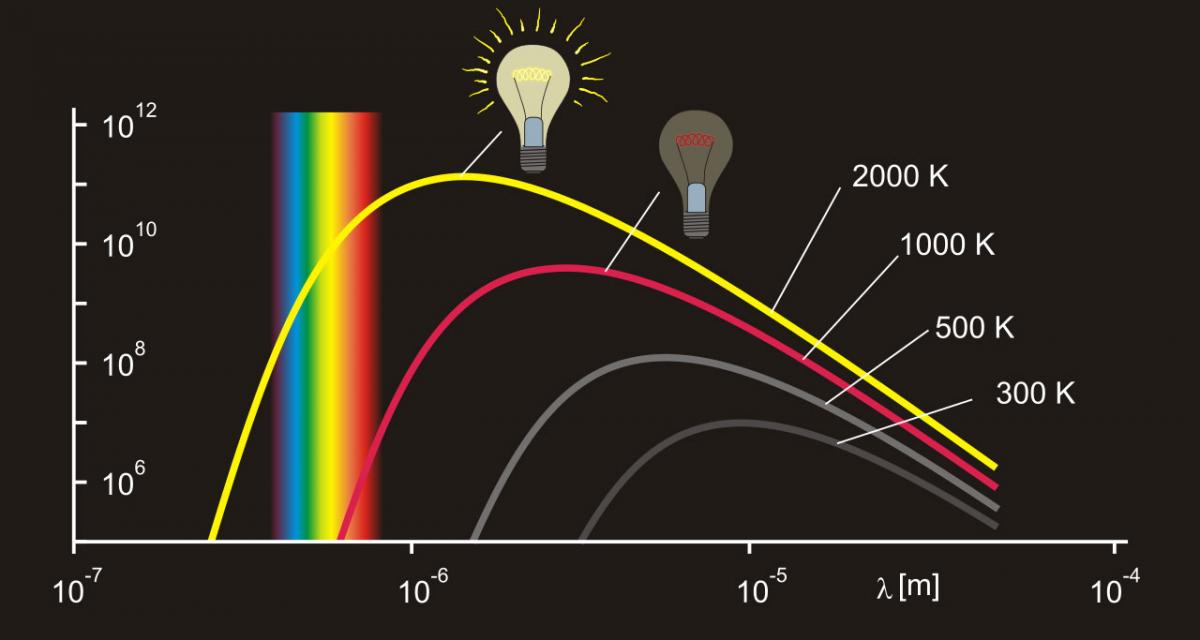
Image courtesy of Mpfiz/Wikimedia
Wien’s displacement law (equation 2) states that the peak wavelength of the spectrum of emitted light is inversely proportional to the absolute temperature. In other words, when a black body is heated, the radiation emitted with higher intensity is displaced to shorter wavelengths (red, orange, yellow, and so on):
λmax = b/T (2)
where λmax is the wavelength of maximum intensity, T the absolute temperature and b the Wien’s displacement constant.
A lamp’s filament at 2000 K will shine a reddish light because the visible light it emits is mainly longer wavelengths. At 3000 K, the filament will not only shine brighter but also emit a yellow light, because the light now has shorter wavelengths (figure 2).
The Stefan–Boltzmann and Wien’s displacement laws that explain the filament’s behaviour, and their mathematical equations, are studied by secondary school students (15 years and older), but they can be demonstrated to the general public and even to young children with something as simple as a light bulb. The lamp’s filament is a cheap, safe and accessible black body, whose temperature – and, therefore, emitted light – can be controlled.
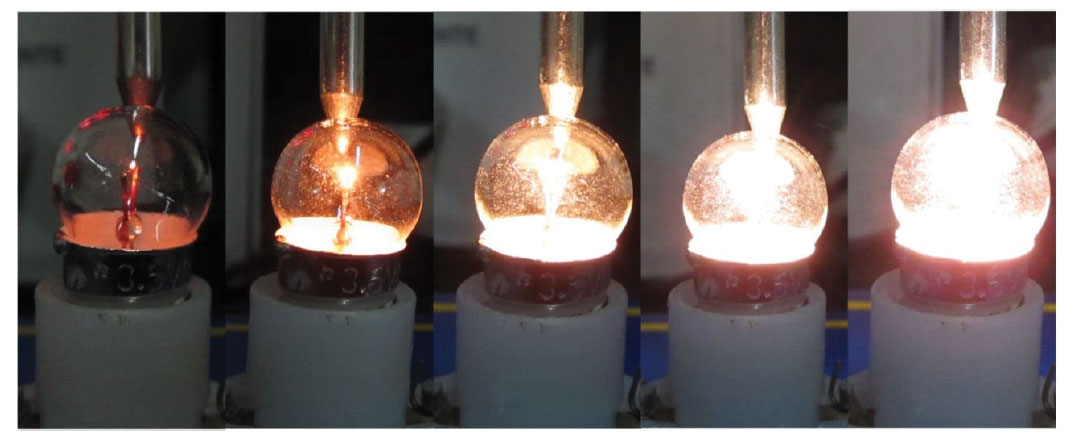
Image courtesy of Carla Isabel Ribeiro
The incandescent lamp
For many years, incandescent light bulbs were the most common lamps used in our homes. The tungsten filament, which is heated to incandesce by an electric current, is responsible for the light emitted. Tungsten is used because it has a high melting point of 3695 K (3422 °C).
The electric power (Pe) input to the lamp depends on the voltage (V) and the electric current (I) according to Ohm’s law:
Pe = IV (3)
If we assume that all the electric power (equation 3) is radiated by the filament (equation 1) and that the filament behaves like a perfect black body, then we can vary the filament’s temperature, and the light it emits, by controlling its voltage and electric current :
IV = AσT4 (4)
Measuring the temperature of a black body
Materials
experiment
Image courtesy of Carla Isabel
Ribeiro
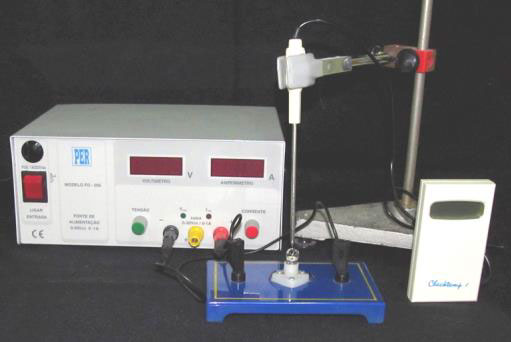
The experiment requires only a 3.5 V light bulb and a variable DC energy supply (or a battery and a rheostat) and a digital thermometer.
Procedure
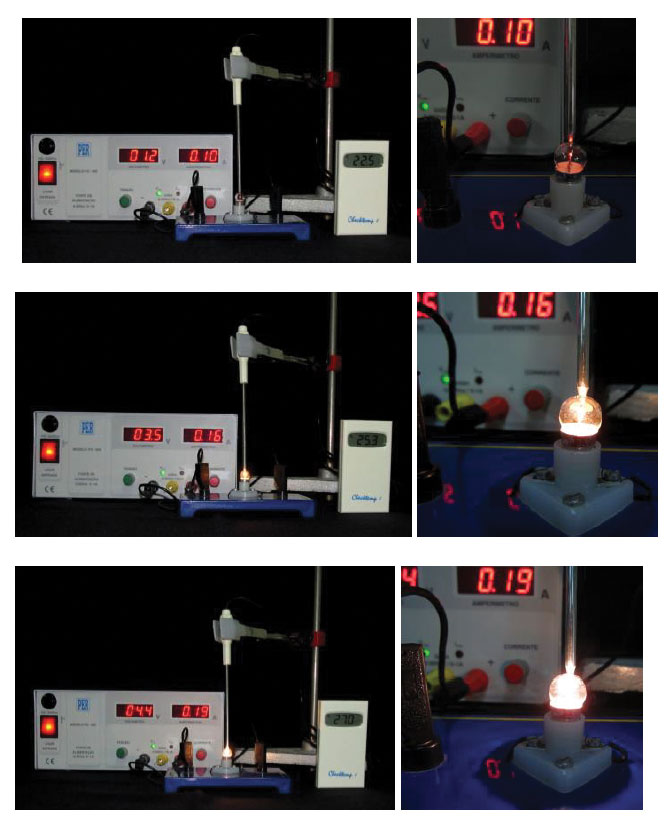
The increase in the filament’s temperature can be inferred by the glass bulb’s temperature, measured by a thermometer. The experimental set-up is simple : the lamp is connected to the variable DC energy supply and a digital thermometer is placed so it touches the lamp’s bulb (figure 3).
Gradually increase the voltage, observe the colour and intensity of the light emitted by the lamp, and measure the bulb’s temperature (figure 4). Try to avoid a completely dark room so that staring at the lamp is not uncomfortable.
About what happens
showing how the
temperature (measured by
the thermometer on the
right) increases as the
voltage increases
Image courtesy of Carla Isabel
Ribeiro
As the voltage increases, so does the temperature of the filament and bulb. The colour and intensity of the light also changes.
Starting at a low voltage, the lamp shines a dim red light. As the voltage and the filament’s temperature increase, the light becomes more intense and changes colour: from red to orange, yellow and then white.
Although the filament can reach temperatures of up to ~3000 °C, it is too small to release much heat so the bulb itself has a low temperature. Nonetheless, it’s possible to infer that red light is related to a lower filament temperature and that orange, yellow and white light is linked to increasingly higher temperatures. The filament cannot reach the temperature required to emit blue light; the metal would simply melt.
Based only on this experiment, it’s possible to deduce that the surface of the stars Betelgeuse and Aldebaran (red/orange) are colder than the Sun (yellow) and that Sirius (white/blue) is hotter than all of them. And, although it could not be shown using the incandescent lamp, Rigel (blue) is the hottest of all the stars described here.
The stars’ surfaces can reach higher temperatures than the tungsten filament, so their colour range is greater. This is represented by the Hertzsprung-Russell (H-R) diagram (figure 5), which plots the stars’ temperature against their luminosity. Our experimental results are consistent with the temperature information in this diagram: unlike the convention for water taps, which marks hot water with red and cold water with blue, a red star is much colder than a blue star. Although it seems to contradict the Stefan–Boltzmann law, the brightest stars are not always the hottest due to their size (a white dwarf is hotter than the Sun, but because it is much smaller, it does not shine as brightly).
We do not see any green stars because of how we interpret lightw1. A star that emits mainly green light also emits red and blue light, and the sum of all the visible radiation emitted is perceived by our brains as white light.
Other incandescent bodies
Stars and incandescent lamps are not the only examples of objects that shine because they are hot. Lava and heated metal worked by a blacksmith are other, albeit less common, examples of incandescent bodies. Like the lamp’s filament, they glow because they are hot; they emit red light when their temperature is lower and yellow/orange light when it is higher.
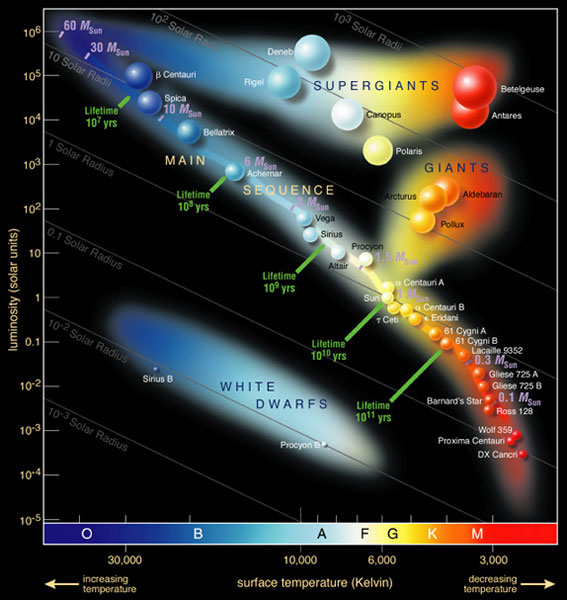
Image courtesy of ESO/Wikimedia
Light sources and colour temperature
Remember, the light emitted by a light source does not always indicate its temperature. A simple example is the fluorescent lamps in our homes.
Whereas the filament of the incandescent light bulb is about 2700 K, fluorescent lamps are much colder (and energy efficient). The mechanism that produces the light in fluorescent bulbs is different, so the colour and temperature of these light sources are not linked in the same way.
It’s possible to differentiate incandescent and fluorescent lamps by their light spectrum by using an object as simple as a DVD to act as a diffraction grating. The light from an incandescent object has a continuous spectrum whereas the other sources of light do not. So, if the spectrum is discontinuous, then the rule that links temperature and light colour does not apply.
Web References
- w1 – Understand why there are no green or purple stars by watching a short video on the How Stuff Works website.
Resources
- Learn more about the night sky and how astronomers investigate the life cycle of stars:
- Mignone C, Barnes R (2014) More than meets the eye: how space telescopes see beyond the rainbow Science in School 29: 49– 54.
- Learn how to build your own spectrometer:
- Westra, MT (2007) A fresh look at light: build your own spectrometer Science in School 4: 30–34.
- For a step-by-step lesson plan on how to calculate the temperature of stars based on their emission spectra, read:
- Olivetto C. et al. (2014) Camping under the stars – the ESO Astronomy Camp 2013 Science in School 30: 8–15.
- Read more about how living creatures produce their own light of different colours in this Science in School article on chemiluminescence:
- Welsh, E (2011) What is Chemiluminescence? Science in School 19: 62–68.
- Max Planck was a German theoretical physicist best known for devising Planck’s constant, as part of his work on black body radiation. Learn more about Planck’s constant, including a method to determine it yourself:
- de Amorim e Sá Ferreira André MR, de Brito André PS (2014) Classroom fundamentals: measuring the Planck constant. Science in School 28: 28–33.
Review
The article proposes an experimental method for highlighting the colour dependence of the star’s temperature and is a welcome support for astrophysics lessons.
The students learn more easily with experiments and generally they have a misconception about the stars’ colour which can be removed with a simple bulb.
The experiment can be extended by getting the students to make a class Hertzsprung–Russell (H–R) diagram. Give each student the name of a star, and they have to find on internet the main characteristics of this star: temperature, age, brightness, luminosity. Then they fill these features on a dot with the same colour as the star and put the dot on a big H–R poster.
The article can be useful for young students: 11–13 years old without the theoretical part from the beginning, only with the experiment and with H–R diagram with coloured dots. The older students can use the formulas from the article to calculate different parameters.
Corina Toma, Computer Science High School “Tiberiu Popoviciu” Cluj Napoca, Romania