


Classroom fundamentals: measuring the Planck constant Teach article
Bring discovery into the classroom and show students how to evaluate Planck’s constant using simple equipment.

Akimbomidget/ Wikimedia
When we think of the evaluation of fundamental physical constants, such as the speed of light or the force of gravity, we probably think of famous, large-scale experiments – but classroom equipment can also be used to calculate these unvarying values.
The Planck constant may seem a rather rarefied concept unlike, say, the speed of light, but it plays an absolutely central role in understanding the behaviour of matter at the subatomic level. It is a cornerstone of the theory of quantum mechanics, which describes the strange behavior of particles at this level. Here energy, as well as matter, is made up of particles. Light and other electromagnetic radiationw1, for example, consists of particles called photons.

Image a Public Domain
Image/ Wikimedia
Named after German physicist Max Karl Planck (1858–1947), the Planck constant tells us how the energy of individual photons relates to the wavelength of their radiation, as this key equation shows:
Ep = hc/λ
Where Ep is the energy of a single photon (in joules), h is the Planck constant, c is the speed of light in a vacuum, and λ is the radiation’s wavelength.
Perhaps surprisingly, even though the value of the Planck constant is extraordinarily small, we have developed a method of determining this value in a classroom experiment. The activity needs no special equipment – just a few coloured light-emitting diodes (LEDs) and standard electrical apparatus. This activity is suitable for a wide range of students, from the age of about 16 up to postgraduate level.
How LEDs work
LEDs are produced by the junction of two ‘doped’ semiconductor materials, one of which has an excess of electrons (n-type) and the other a lack of electrons – also designated as holes (p-type). When an electrical current is injected through this so-called ‘p-n’ junction, the recombination of electrons and holes releases energy in the form of photons.

the voltage-current response
of each LED. From left to
right: battery, potentiometer
or rheostat, voltmeter,
ammeter, LED.
Image courtesy of the authors
The colour of the light emitted from an LED is determined by the energy of the photons, which can be tailored by changing the chemical composition of the semiconductor materials. LEDs are most commonly made from alloys of gallium, arsenic and aluminium, and changing the proportion of these constituents can produce LEDs that emit light in specific colours – such as red and green in the visible region of the electromagnetic spectrum, or beyond into the ultraviolet and infrared regions.
As with any light, it is the wavelength that determines its colour. The human eye is sensitive to light with wavelengths from about 390 to 700 nanometres (0.00039–0.0007 mm). We see the shortest wavelengths as violet and the longest as red, and each in between corresponds to a particular colour in the spectrum. For example, green-emitting LEDs typically produce light with a wavelength of around 567 nanometres.
We use LEDs in this experiment because each colour of LED has a different threshold voltage at which electrons start being produced. Measuring this voltage, together with known values for the emission wavelengths, provides a path to finding a value for the Planck constant.
Materials
- Four LEDs emitting coloured light – one each of red, orange, green and blue. Choose LEDs with a clear, colourless casing surrounding the LED, so that the colour of the light comes from the device itself, not from the coloured casing.
- 9 V battery.
- Two multimeters (one to be used as a voltmeter and the other as an ammeter).
- 1 kΩ potentiometer or rheostat.
Procedure
- Set up the circuit as shown in the diagram above. Connect the ammeter in series with the LED to measure the current through it, and connect the voltmeter in parallel to the LED to measure the voltage across it. The applied voltage can be changed by using the potentiometer or rheostat.
- Change the voltage in steps of 0.05 V from 0 V to 3 V, and measure the resulting electrical current. Note that when the current flowing through the LED is small, the LED might not light up, but the ammeter can still measure the current. To protect the LED, take care to keep the current below 5 mA.
- For each LED, plot a graph of current against voltage, similar to the graphs shown to the left. On each graph, find the straight line of ‘best fit’ to join up the points that slope up from the x-axis. If the points lie close to the line, this shows that a linear relationship holds between the applied voltage and the current in this region of the graph
- Finally, determine the activation voltage (Va) from the collected data. This is the point at which the current begins to increase linearly with voltage. It can be read off the graph by extrapolating the straight line representing the linear response region backwards until it intercepts the x-axis. Students can do this visually using a ruler, or mathematically by applying linear regression to the experimental data points in the linear regionw2.

Image courtesy of the authors
To obtain the most accurate values of Va for each colour of LED, you can calculate an average value using the results obtained by several students.
Typical values for activation voltages obtained via this experiment are shown on the right, together with wavelength values for the light emitted by colour LEDs. You can provide students with these wavelength values for the next stage of the classroom activity. Alternatively, the wavelengths can be measured using a homemade spectrometer, such as the one described in the web resource beloww3.
| LED colour | Typical wavelength, λ (cm) | Activation voltage, Va (V) |
|---|---|---|
| Red | 623 | 1.78 |
| Orange | 586 | 1.90 |
| Green | 567 | 2.00 |
| Blue | 467 | 2.45 |

Image courtesy of entirelysubjective/Flickr
Analysis and results
As we saw earlier, the energy of emitted photons, Ep (measured in joules), is related to the Planck constant (h), the speed of light in a vacuum (c), and the wavelength of the light λ:
![]() (1)
(1)
In this experiment, we have a range of values for from the known wavelengths of the LED light colours, and we know the value for c (2.9979 x 10⁸ ms-1). But how do we use our experimentally obtained values of Va to calculate the Planck constant? To find out, let’s consider what is happening within the LEDs.
When the LEDs are operating at low voltage values, the energy input is not enough to produce photons and the electrical current is very small. At a certain voltage, the LED starts to emit photons: this is the activation voltage, Va. This minimum voltage for each colour of LED correlates with the energy of the emitted photons, Ep (equation 2). And in fact, like Ep, Va is mathematically related to the Planck constant and the wavelength of the emitted light, as shown in the equation below:
![]() (2)
(2)
Where e is the charge on the electron (1.6022 x 10⁻¹⁹ coulombs). For voltages higher than Va the electrical current is determined by the LED’s internal resistance. From Ohm’s law, voltage = current x resistance, producing a linear relationship between the electrical current and the applied voltage, as seen in the voltage-current graphs above.

domes on the bank of the
Swan River, Perth, Western
Australia
Image courtesy of Gnangarra/
Wikimedia
In equation 2, the term (ϕ/e) is a constant that relates to the energy losses inside the semiconductor’s p-n junction. (For simplicity, we can assume this constant to be equal for all the LEDs.) Since ϕ is unknown, it is not possible from equation 2 to determine the Planck constant by measuring the activation voltage alone. However, if the activation voltage is measured for several LEDs emitting at different known wavelengths, then we can find a value for h by plotting a graph of Va as a function of the reciprocal of the wavelength (1/λ).
This is because rearranging (2) gives this equation:
![]() (3)
(3)
Thus, the graph of Va against 1/λ will take the form of a straight line with a gradient of hc/e (from which the Planck constant can easily be calculated, given the known values of e and c. This gradient can be found graphically by plotting the graph and drawing a line of best fit to the data, or mathematically using a linear regression calculatorw2.
Linear regression gives the following value for the gradient (m): m = 1.24811 x 10⁻⁶ Vm (volt metres) From this, the Planck constant can finally be calculated. From above, m = hc/e, so:
![]() (4)
(4)
= 1.6022 x 10-19 x 1.24811 x 10-6/2.9979 x 108
= 6.6704 x 10⁻³⁴ Js (joule seconds)
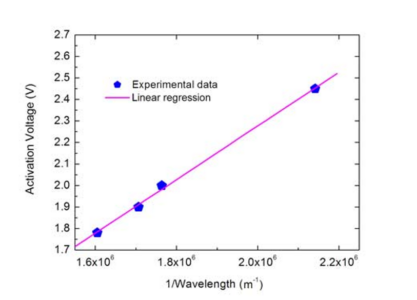
Image courtesy of the authors
This value compares well with the accepted value for the Planck constant of 6.62606957 x 10⁻³⁴ Js – an error of just 0.7%w4. The values your students obtain may be a little wider of the mark, but should still provide a satisfyingly good approximation to one of nature’s fundamental constants.
Web References
- w1 – To learn more about light and the electromagnetic spectrum, see:
- Mignone C., Barnes R. (2011) More than meets the eye: the electromagnetic spectrum. Science in School 20: 51-59.
- w2 – Online linear regression calculators that can help analyse your data include:
- w3 – To learn how to build your own spectrometer, see:
- Tiele Westra M. (2007) A fresh look at light: build your own spectrometer. Science in School 4: 30-34.
- w4 – The National Institute of Standards and Technology (NIST) reference value for the Planck constant.
Resources
- The University of Nottingham’s ‘Sixty Symbols’ project has produced a short video explaining the importance of Planck’s constant.
Review
This article presents a simple, practical experiment that can be used to verify the value of the Planck constant, which is widely used in quantum physics. The set-up is easily reproducible in class, as the materials used are commonly found in physics labs. It can therefore be used either as a demonstration in class or as an investigation performed by students themselves.
The theory involved in this topic can initially appear to be abstract for students to understand, but such an experiment will help them to clarify some concepts and understand better the theories involved. The article and the experiment demonstrates some very important concepts, such as:
- the photo-electric effect, where ‘packets of energy’ are absorbed by a material and consequently cause a diode to emit electromagnetic waves;
- the activation voltage in diodes;
- calculation of the Planck constant.
Catherine Cutajar, Malta