


What are stars made of? Teach article
Find out how we know what the Sun (and stars) are made of.
Unlike other components of the Solar System, such as planets and satellites, stars are out of reach for spacecraft or, in the Sun’s case, too hot to approach. So how can we understand them, if we can’t use probes, rovers or astronauts to study them? The answer is that we must rely on their light. We know that a star’s colour gives away its temperature (Ribeiro, 2015), but how do we know what stars are made of? Again, star light, or more specifically, the star’s spectrum, is the answer.
At the Science on Stage festival held in London in June 2015, a discussion about combining hands-on experiments with teaching about a star’s chemical composition arose between us, and so the idea for this activity was born. The activity is designed to allow students aged 15–18 to explore different light spectra and understand how they can be used to identify chemical elements in lamps and, more importantly, in our closest star, the Sun.
Light spectra
In his famous experiment in 1666, Isaac Newton used a prism to show that light could be split up into component colours and that these colours could recombine to generate white light. He demonstrated that the colours did not originate in the crystal, as was previously believed, but that instead they were the components (or wavelengths) of sunlight. He introduced the word ‘spectrum’ to describe the rainbow of colours and his discovery kickstarted the science of spectroscopy.

To Newton, the Sun’s spectrum appeared to be continuous, with no gaps between the colours. But in 1814, Joseph von Fraunhofer discovered that when the light is sufficiently dispersed through a narrow slit, the spectrum contains a number of dark lines, now known as Fraunhofer lines (figure 1). About 45 years later, these lines would prove essential in determining the composition of the Sun, thanks to the work of Gustav Kirchhoff and Robert Bunsen.
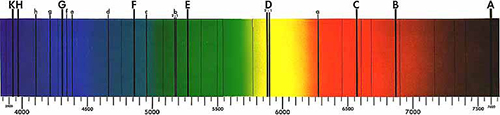
Public domain image; image source: Wikimedia Commons
In 1860, Kirchhoff and Bunsen studied a different kind of spectrum. Instead of observing dark lines against a bright background, they studied the bright lines on a dark background, emitted when they heated elements in Bunsen’s gas flame. One such spectrum was for sodium (figure 2), which can be obtained by burning table salt (NaCl) or shining a low-pressure sodium lamp, like those used in street lights.
Bunsen and Kirchhoff concluded that chemical elements could be identified using these emission lines and, with that in mind, they found two new elements within two years: caesium and rubidium.
Kirchhoff continued his work and realised that the emission lines coincided with several Fraunhofer lines. For example, the bright yellow line of the sodium spectrum was in the same position as a dark line in the yellow region of the solar spectrum, named ‘D’ by Fraunhofer.

Public domain image; image source: Wikimedia Commons
These early experiments revealed that there were three main types of spectra; continuous, absorption, and emission. The first shows all the wavelengths, the second contains only some of the wavelengths of light, and the third shows gaps, or dark lines against a bright background. These spectra are formed according to Kirchhoff’s three spectroscopy laws:
- A continuous spectrum is emitted by an incandescent solid, liquid or gas under high pressure.
- An absorption spectrum is formed when a continuous spectrum passes through a cool low-density gas.
- An emission spectrum is emitted by a hot gas under low pressure.
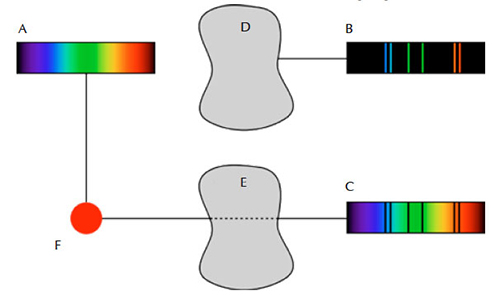
Public domain image; image source: Wikimedia Commons
Kirchhoff had not only found that a chemical element was responsible for spectral lines in the same position in both the emission and absorption spectra, but he had also discovered that the Sun contains sodium. So, to know the composition of the Sun, and any other star, we just need to compare the spectra of known elements to the spectra of the star.
Taking spectra of different light sources
Materials
- Several light sources (such as incandescent lamps, fluorescent lamps, street lamps and neon lights)
- Spectrometers – built using a cereal boxw1 (see classroom activity box) or by purchasing and assembling a foldable mini-spectrometer kit (available onlinew2).
- Emission spectra for different elements – suitable images can be found in books or downloaded from the internetw3.
Building a spectrometer
Materials
- Cereal box
- Thick paper
- CD
- Scissors
- Dark tape
Procedure
- On one of the narrow sides of the box, cut into the box to make a horizontal slit. To make a clean line you could use tape to stick two small pieces of thick paper close together, leaving a small slit in between. An ideal width is 0.2 mm.
- Cut the CD in half using a pair of scissors. On the opposite side to where you just cut the slit, cut another horizontal line. Extend this line beyond the corners of the box on either side so that when you slide the CD through the slit, it is mounted at a 60° angle to the bottom of the box.
- Cut a hole on the top of the box, through which the CD can be observed.
- Exclude any stray light from the box by covering the edges of the CD with dark tape.
For more information on building this spectrometer, click here.
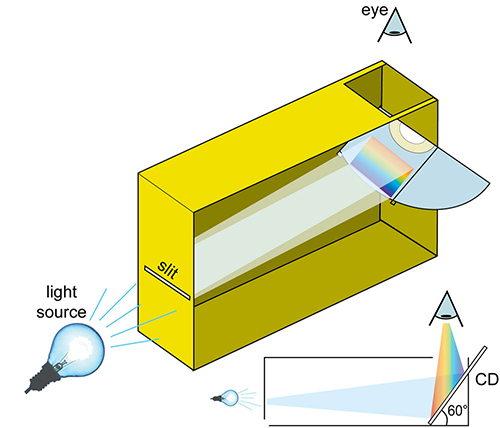
Image courtesy of Mark Tiele Westra
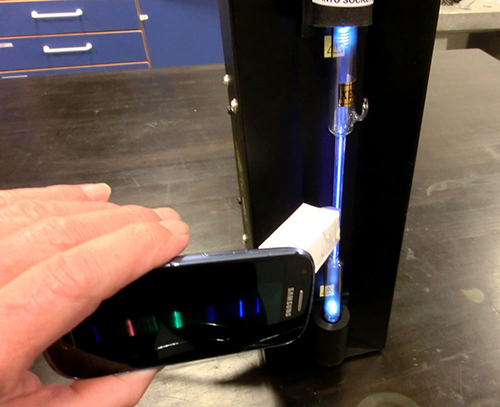
An alternative option is to use the foldable mini-spectrometer, available to buy onlinew2. It allows the students to photograph the observed spectra using a smartphone.
Safety note
Do not look directly into the Sun, even with a spectrometer. Instead, point your spectrometer at the sky to observe a spectrum of diffused sunlight.
Procedure
Comparing spectra
Ask the students to observe the light from the various light sources through a spectrometer. This will show them that not all light sources are the same, because their spectra are not the same.
Questions:
- What type of spectrum is emitted by each light source?
- What does this tell you about the type of light source?
- Which light source is most often used and why?
Explanation:
The students will observe a different spectrum depending on the light source:
- An incandescent bulb emits a continuous spectrum with all visible colours present.
- A gas-discharge lamp typically contains helium (He), neon (Ne), argon (Ar), krypton (Kr) and xenon (Xe) (figure 3). Each gas emits its own emission spectrum.
- Street lamps usually contain sodium so will emit the emission spectrum for sodium.
- The spectrum emitted by an LED bulb depends on the LED’s semiconductor material. A blue LED creates a continuous spectrum with a brighter blue part of the spectrum.
- The Sun emits a continuous spectrum. A more sophisticated spectrometer will show the dark absorption lines determined by the elements through which the light passes in the solar atmosphere.
The different spectra indicate that these sources of light, and the mechanism behind their formation, are different, except for the Sun and the incandescent lamp. The light source most often used is incandescent because it has a continuous spectrum like the Sun.
Analysing emission spectra
Using different gas-discharge lamps, ask the students to identify the elements present by comparing the lamp’s spectrum with printed images of different elements’ emission spectra. This is the basis of spectroscopy as a method of chemical analysis.
Safety note
As gas-discharge lamps require a high voltage, they should be handled by the teacher.
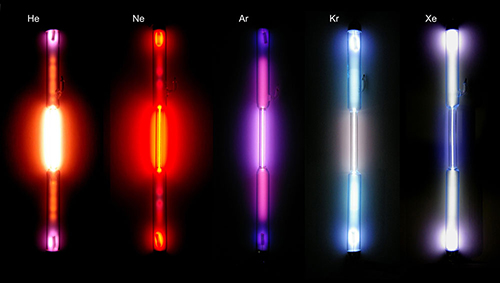
Image courtesy of Heinrich Pniok; image source: Wikimedia Commons
Questions:
spectrometer to obtain the
helium emission spectrum.
Image courtesy of Ole Ahlgren
- Do all the spectral lines have the same intensity?
- What is the relationship between the spectral lines and a lamp’s colour?
- How can the spectra be used to identify different chemical elements?
Explanation:
Some wavelengths are more intense than others, which results in some emission lines being brighter than others. This is shown in the lamp’s colour. For example, the light of a sodium lamp is yellowish in colour because it emits mainly yellow, despite also emitting red and green light. Since each element has its own specific wavelength, you can use spectra to identify which chemical elements are present.
Extending the activity
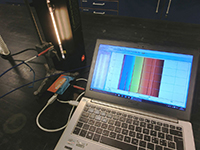
To get more detailed results, further activities can be carried out with a spectrometer capable of detecting the Sun’s absorption lines, and by using appropriate data-logger software. Figures 4 and 5 were taken using the Ocean Optics Red Tide spectrometer and the program LoggerPro.
The spectra obtained are different from those taken with a simple spectrometer, and contain more information, including the wavelength of each spectral line and its relative intensity. The Sun’s spectrum can also show that the presence of absorption lines doesn’t mean that certain wavelengths of light are completely missing, just that they are less intense than other wavelengths.
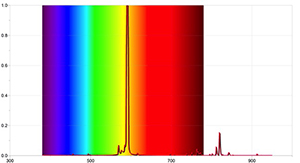
Image courtesy of Ole Ahlgren
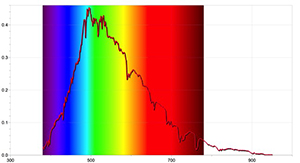
Image courtesy of Ole Ahlgren
spectrum with the Ocean
Optics Red Tide spectrometer
and the programme LoggerPro.
Image courtesy of Ole Ahlgren
Materials
Procedure
Students can record the Sun’s spectrum using the more sophisticated spectrometer. The data-logger program will give the wavelength of the absorption lines that the students choose. The absorption lines chosen should be the most prominent. To determine the elements present, there are two choices:
- The students compare each wavelength with the ones from a table, like the one available at the Columbus Optical SETI Observatory pagew6.
- The students log the emission spectra of several elements and then compare the lines’ wavelengths to the ones of the Sun. The number of elements that can be used is limited to those present in the gas-discharge lamps. It is possible to burn metals and obtain the emission spectrum, but there will be lines from other elements. For example, the most prominent lines shown in figure 6 when burning magnesium are due to the presence of nitrogen.
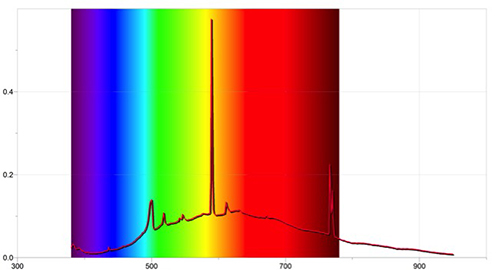
Image courtesy of Ole Ahlgren
By taking spectra of different light sources and chemical elements and comparing them with the spectrum of the Sun, the students learn how we can determine the composition of the Sun and other stars.
References
- Ribeiro C (2015) Starlight inside a light bulb. Science in School 31: 37–42.
Web References
- w1 – For instructions for building your own spectrometer using a cereal box, see: Westra M (2007) A fresh look at light: build your own spectrometer. Science in School 4: 30-34.
- w2 – You can order a foldable mini-spectrometer kit online from the Public Laboratory store.
- w3 – Emission spectra for various elements can be downloaded from Open Discovery Space.
- w4 – Examples of suitable spectrometers to use for the extension of this activity can be found here.
- w5 – LoggerPro is an award-winning, data collection and analysis software for Windows and Mac computers.
- w6 – Fraunhofer lines and their wavelengths can be viewed on the Columbus Optical SETI Observatory website.
Resources
- For an overview of the practical uses of light, see:
- Douglas P, Garley M (2010) Chemistry and light. Science in School 14: 63-68.
- Science on Stage is the network for European science, technology, engineering and mathematics (STEM) teachers, which was initially launched in 1999 by EIROforum, the publisher of Science in School. Science on Stage brings together science teachers from across Europe to exchange teaching ideas and best practice with enthusiastic colleagues from 25 countries.
Institutions
Science on StageReview
Within this article, the authors describe briefly how spectra were discovered and how different kinds of spectra can be used to identify what stars are made of.
They also show how self-made spectrometers can be built and used for spectral measurements. This teaching activity can provide fascinating results using these spectrometers.
Comprehension question on the topic might be:
- How did Newton discover the spectrum of light?
- Which colours are included in the spectrum of light?
- At which colours does the visible light spectrum start and end?
- Describe the discoveries of Bunsen and Kirchhoff.
Gerd Vogt, Higher Secondary School for Environment and Economics (HLUW), Yspertal, Austria