


The ‘Radon school survey’: measuring radioactivity at home Teach article
Marco Budinich and Massimo Vascotto introduce a school project to measure radon levels in your own home.
The simple word ‘radioactive’ evokes something both mysterious and scary, and few realize that, most of the time, radioactivity is a natural phenomenon we have to live with. Radon is a naturally occurring radioactive gas and is the most frequent cause of lung cancer after smoking, representing the form of radioactivity with highest social impact.
Radon leaks out of rocks and, because it is a gas, mixes with the air we breathe. The higher its concentration, the more radioactivity we are exposed to. Radon concentration is quite erratic: one house may be filled with radon while the neighbouring houses have no detectable radon levels. Since radon comes mainly from rocks, its concentration is correlated with soil composition, water occurrence and, more generally, geology. Knowing how much radon we breathe at home is thus important for our healthw1. The ‘Radon school survey’ (RSS) projectw2, w3 involves high-school students measuring radon concentration in their own homes.
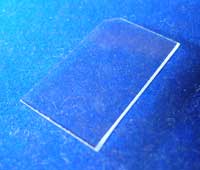
Image courtesy of the University
of Trieste
Normally, measuring radon requires equipment well beyond the budget of a school; instead, we used a simple, safe and robust method to produce meaningful results by detecting a-radioactivity from radon. The nucleus of a radon-222 atom decays into polonium-218, emitting a ‘heavy’ α-particle (a helium-4 nucleus). When the α-particle strikes a solid object, it causes local damage, as a bullet would to a wall: it leaves a little hole or nuclear track. Our ‘wall’ was a tiny plastic target; after exposing it to radiation, we could simply count the number of holes left by the α-particles, and from that information, calculate the average radon concentration during the exposure time.
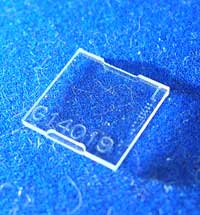
Image courtesy of the
University of Trieste
The plastic we used, CR39, (also known as PADC – poly allyl diglycol carbonate), was developed for the construction of aeroplane cockpits in World War II and is now used in unbreakable optical lenses, and also in nuclear physics to detect α-particles and neutrons.
Materials
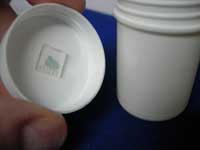
- For each student, a CR39 radon dosimeter in a plastic screw-top box (see Figure 3). (See the list of suppliers for more information)
- Sodium hydroxide (NaOH)
- Distilled water
- A water bath (or cheap thermostatic fryer)
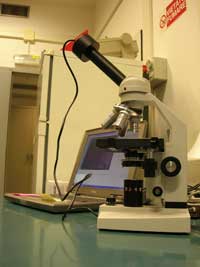
- A microscope with micro camera (see ‘Suppliers’)
Method
‘exposure camera’
Image courtesy of the
University of Trieste
- To quantitatively measure the level of radon, leave the dosimeter for one to six months in the same place. The bedroom is a good choice to reflect our exposure to radon, as it is a place where we spend a lot of time. After that, the detector is ready to be analysed.
To make the nuclear tracks left by the α-particles visible with a simple microscope, they must first be widened by chemical etching.
- Place the dosimeter in a beaker and cover it with a solution of 240 g sodium hydroxide per litre of distilled water. Heat at 80°C for at least 4 h. (If you are using a thermostatic fryer, test the water temperature first.) If you are preparing several dosimeters, use fresh sodium hydroxide solution for each one.
Safety note: sodium hydroxide is corrosive, and must be handled with care.
micro camera
Image courtesy of the
University of Trieste
- Leave the dosimeter to etch for 4 h, then rinse it well. The tracks are now about 10 mm in diameter and can be viewed with a microscope.
- Place the dosimeter under the microscope, take some pictures, and use them to count the nuclear tracks and to determine their average density (Figure 5).
Radon concentration is calculated using the formula:
Rn is the radon concentration (Bq/m3)
D is the track density (number of tracks/m2)
fc is the calibration factor (the density of tracks corresponding to 1 Bq/m3 per exposure day; this information is provided by the manufacturer)
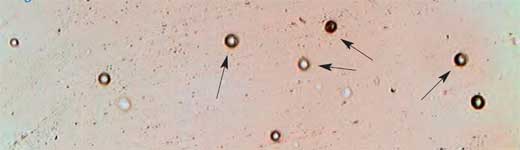
Image courtesy of the University of Trieste
Sample results
The radon concentration found in our houses can vary by four orders of magnitude over the course of one day, and depends on many factors including weather, air circulation and pressure, and other seasonal changes. What is important for health purposes, however, is the average radon concentration. For that reason, radon measurements are typically taken over long periods.
Since the project began in 2003, some 2000 high-school students in Friuli Venezia-Giulia (north-east Italy) have taken part. Using calibrated CR39 dosimeters, we have performed four long-term surveys, some short-term measurements and a few verifications of sites with high radon levels. The project is still continuing, and schools that carry out measurements are welcome to submit their data to our project.
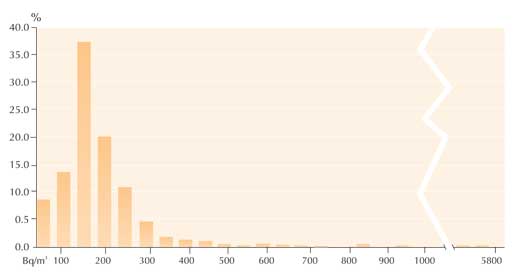
In the summer of 2005, 89% of the 897 radon measurements made by the students were under 200 Bq/m3, i.e. below the limit that the European Commission recommends for new buildings (The Commission of the European Community, 1990). Only 2% (22 measurements) exceeded the limit of 400 Bq/m3 recommended for pre-1990 buildings. Of those, 0.4% (4 measurements) exceeded 1000 Bq/m3, with the highest measurement being 5699 Bq/m3 (see graph).
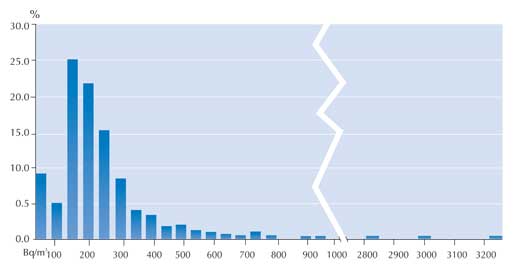
In the winter of 2007, the 860 measurements were generally somewhat higher: 70% below 200 Bq/m3 and a further 20% between 200 and 400 Bq/m3. In this survey, 10% (88 measurements) exceeded the limit of 400 Bq/m3. However, the highest measurement made was lower than that of summer 2005: only 3227 Bq/m3 (see graph).
| Radon measurement (Bq/m3) | Summer 2005 survey (n=897) | Winter 2007 survey (n=860) |
|---|---|---|
| Rn≤200 (limit for post-1990 buildings) | 89% (795) | 70% (604) |
| 200<Rn≤400 (limit for pre-1990 buildings) | 9% (80) | 20% (168) |
| Rn>400 | 2% (22) | 10% (88) |
In those cases where levels of radon above the limit were detected, the measurement was repeated, and if the levels were still too high, we recommended that the students contact the regional environmental protection agency, which could advise on how to keep radon out of the house. An example of a simple radon reduction method is to ventilate rooms. More labour-intensive methods include insulating the house from the ground.
Suppliers
CR39 can be bought from optical lens manufacturers or from suppliers of radon detectorsw4 (see Figures 1 and 2). Optical lens manufacturers sell the plastic material (CR39) cut into any shape (about €1), while the detector suppliers sell a calibrated, ready to use, CR39 radon dosimeter (about €7). One suggestion is to use the cheaper option for a yes/no measurement, reserving the more expensive detectors for places where radon has already been detected.
We use a cheap Konus Academy microscopew5 (models 5304 & 5829) with a micro camera and the associated imaging software (see Figure 4).
The RSS project
The RSS project is very multidisciplinary, involving not only physics but also chemistry, geology (for soil properties), mathematics (involving, for example, the exponential decay law and Poisson distribution of tracks), and social considerations (incidence of radon risks).
The topic sheds some light on the ‘dark mysteries’ of radioactivity and is socially relevant, especially in a radon-prone area like our region; students and their parents are usually curious to know the radon level in their houses. So far, the project has involved almost 5000 people in our region – students, families, teachers and school personnel – making them aware of a health risk.
Besides measuring radon, the other major goal of this project is to interest high-school students in science and scientific careers, by getting them to take part in a real scientific study, carrying out the measurements themselves. Students are made aware that we are surrounded by science and that it is possible to do serious science in everyday life, with simple equipment.
The organisers of the project and many of the participants are now involved in a further projectw7 – to investigate the levels of 137caesium left in their region as a result of the Chernobyl accident in 1986.
Acknowledgements
We would like to thank all students, teachers, school personnel and families involved in the project and our collaboration partners, the local environment protection agency, ARPAF-VGw6.
We gratefully acknowledge the support of our sponsorsw3, Progetto Lauree Scientifiche, INFN and the Physics Department of the University of Trieste.
References
- The Commission of the European Community (1990) Commission Recommendation on the Protection of the Public against Indoor Exposure to Radon (90/143/Euratom). http://eur-lex.europa.eu/legal-content/EN/TXT/?uri=CELEX:31990H014
Web References
- w1 – For more information about radon, see the websites of the UK Health Protection Agency (www.hpa.org.uk), the US Environmental Protection Agency (www.epa.gov) and the Swiss Federal Office of Public Health (www.bag.admin.ch, in English, Italian, French and German).
- w2 – Further information about the RSS project and detailed protocols for both the measurements and data collection are available on the following websites.
- For a presentation about the project (in Italian), see: www.ts.infn.it/eventi/ComunicareFisica/presentazioni/vascotto.pdf
- For presentations about the project (in both English and Italian), see also the Fisica a Trieste website: http://physics.units.it/didattica03/orientamento/laboratori.php
- w3 – The RSS project was funded by:
- Progetto Lauree Scientifiche, an Italian national project to disseminate scientific culture and raise interest in scientific disciplines and careers; see: www.progettolaureescientifiche.it
- INFN, the Italian National Institute for Nuclear Physics. See: www.infn.it
- The Physics Department of the University of Trieste; see: http://physics.units.it
- w4 – Suppliers of CR39 include:
- Intercast Europe (cheap CR39 without calibration): www.intercast.it
- FGM Ambiente (CR39 calibrated dosimeters): www.fgmambiente.it
- Radosys (CR39 calibrated dosimeters): www.radosys.com
- TASL (CR39 manufacturer): www.tasl.co.uk
- w5 – For more information about Konus (including their microscopes and micro cameras), see: www.konus.com
- w6 – ARPA-FVG is the regional environmental protection agency of Friuli Venezia Giulia. For more information, see: www.arpa.fvg.it
- w7 – For more information about the caesium project, see the (Italian) project web page (http://physics.units.it/didattica03/orientamento/laboratori.php#cesio) or contact Marco Budinich directly (marco.budinich@ts.infn.it)
- w8 – See Marco Budinich’s web page: wwwusers.ts.infn.it/~mbh/MBHgeneral.html
Review
This project shows how the teaching of radioactivity, which is usually a classroom-based topic, can be extended outside the school. Students test for the presence of radon in their own homes and then perform more thorough analyses in the school laboratory; the fact that they can in effect ‘see’ the radiation makes it less abstract. This will motivate the students to research the effects of radon and other sources of radiation, and to conduct careful analyses and detailed interpretation of the results.
Most of the apparatus and materials indicated by the authors are commonly found in a science laboratory. This encourages teachers to try this project with their own students so that they can actually see the effects of radiation in their own homes. Such a project instils in students an investigative approach towards science.
The article can be used in physics lessons to introduce the topic of radioactivity (types of radiation, background radiation, effects of radiation). It could also be used in chemistry (radioactive elements), geology (soil and rock properties) or advanced mathematics (exponential decay and the Poisson distribution) lessons. Moreover, being a rather sensitive topic, it can be extended to class discussions on how radioactivity can be used to serve humanity, and what can happen when radioactivity reaches alarming levels.
Catherine Cutajar, Malta