


Can you spot a cancer mutation? Teach article
How does cancer develop, and how can geneticists tell that a cell is cancerous? This teaching activity developed by the Communication and Public Engagement team from the Wellcome Trust Sanger Institute, UK, answers these and other related questions.
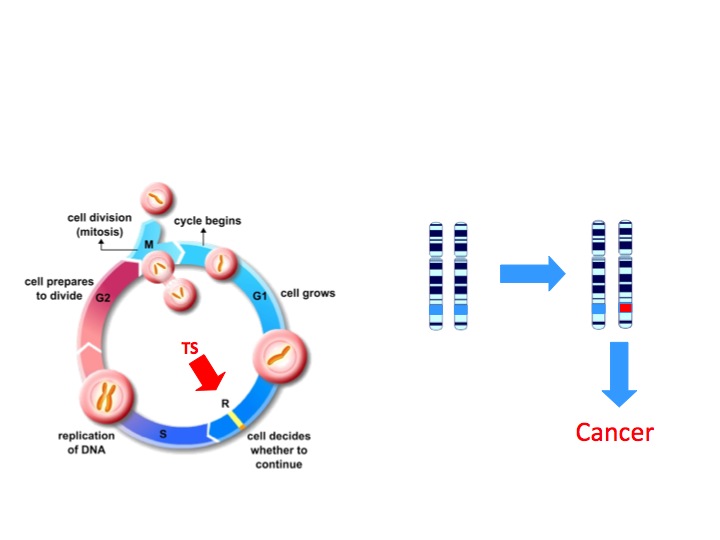
All cancers result from changes to the DNA sequence in some of our cells. Because the genetic material within cells is exposed to mutagens such as UV radiation, it can accumulate mistakes during replication. Occasionally, one of these mutations alters the function of a critical gene, providing a growth advantage to the cell in which it has occurred and its offspring; these cells will divide at a faster rate than their neighbours.
Gradually, the DNA acquires more mutations, which can lead to the disruption of other key genes, resulting in particularly fast-growing and invasive cells. The result is tumour formation, the invasion of the surrounding tissue and eventually metastasis – the spread of the cancer to other parts of the body.
suppressor genes normally
function to prevent cell
growth and division. To lead
to cancer, both copies of the
gene would have to be
mutated (marked in red).
Click to enlarge image
Image courtesy of the
Wellcome Trust Sanger Institute
Communication and Public
Engagement team
Genes that lead to the development of cancer when mutated are known as ‘cancer genes’.
Tumour suppressor genes (TSGs; Figure 1) encode the information for making proteins that normally slow down cell growth, preventing unnecessary division or promoting apoptosis (programmed cell death) if the cell’s DNA is damaged. Both copies of a TSG would have to be inactivated by mutation before this control of the cell cycle is lost. If one functional copy remains, there is still a ‘brake’ on the cell’s growth.

normally function to
promote cell growth and
division in a controlled
manner. A mutation in one
copy of the gene (marked in
red) can be enough to drive
cancer development. Click to
enlarge image
Image courtesy of the
Wellcome Trust Sanger Institute
Communication and Public
Engagement team
Proto-oncogenes (Figure 2), in contrast, encode proteins that promote cell division and differentiation (specialisation). When these genes acquire mutations that either make the proteins continually active or lead to the gene’s activity not being regulated anymore, they become oncogenes, promoting uncontrolled cell growth and division. For proto-oncogenes, a mutation in one copy of the gene can be enough to drive cancer development.
Each individual case of cancer is caused by a unique set of mutations in proto-oncogenes and / or TSGs. Although the number is not yet known, it is thought that five or more mutations in cancer genes are needed for a cell (and its offspring) to become cancerous.
KRAS (pronounced kay-rass) is a proto-oncogene that encodes the protein KRAS, an intracellular signalling protein involved in promoting cell growth (to distinguish genes from proteins, gene names are conventionally written in italics). The following activity enables students to use real genomic data from the Cancer Genome Projectw1 to investigate common mutations in the KRAS gene that are associated with oncogenesis (cancer formation) and the development of pancreatic, colorectal, lung and other cancers. Originally developed for school visits to the Sanger Institutew2, the activity was then made available through the Yourgenome.orgw3 website. It recently formed part of the first course on bioinformatics for European teachers run by ELLSw4 at the European Bioinformatics Institutew5 in Hinxton, UK. The full activity stimulates discussion about the causes of cancer, the function of gene mutations, protein structure and protein function.
The KRAS activity

Sheet. Click to enlarge image
Image courtesy of the
Wellcome Trust Sanger Institute
Communication and Public
Engagement team
Estimated duration: 45–60 minutes (with presentation and discussion)
Materials
All materials required to run the activity can be freely downloaded from the Yourgenome.org website either individually or as a compressed zip filew6.

wheel to translate DNA
codons into amino acids. To
decode a codon find the
first letter of your sequence
in the inner circle and work
outwards to see the
corresponding amino acid.
For example, CAT codes for
H (histidine). Note that this
diagram uses the sense
DNA codons (5’ to 3’). Click to
enlarge image
Image courtesy of C
Brooksbank, European
Bioinformatics Institute
- One set of 11 worksheets (KRAS_student_wsheet.pdf) – one worksheet per pair or group of students. An alternative version is available for black and white printers or for use with colour-blind students. For large groups (20 or more), use two sets of worksheets, providing double coverage of the gene.

synthesised from the
antisense strand of DNA. The
sense strand of DNA, used in
this activity, has the same
sequence as the
corresponding mRNA strand,
except that T is replaced by
U. Click to enlarge image
Image courtesy of Cleopatra
Kozlowski
- One KRAS gene sequence banner (KRAS_gene_banner.pdf) for the whole class, and one KRAS gene sheet (KRAS_genesheet_yg.pdf; Figure 3) per group of students. The gene sheet (printed on A3 or A4) requires little preparation time. The KRAS banner, printed on several sheets of paper that are then stuck together, enables the results from the whole class to be displayed simultaneously.
- One codon wheel sheet (KRAS_codon_wheel.pdf or any other codon table for sense DNA, 5’ to 3’) per group (see Figures 4 and 5)
- One summary sheet (KRAS_ data_sheet.pdf) per group
- Pens
To use the banner, you will also need large arrows for marking mutations on the gene sequence, squares for marking regions which have been checked (KRAS_annotations.pdf), and reusable adhesive (e.g. Blu Tack®) for sticking arrows and squares to the gene sequence banner. Find out more about how to use this method in the downloadable teacher notesw6.
In addition, you might find it helpful to have DNA, peptide and/or protein models to hand, and to use the Wellcome Trust Sanger Institute cancer animations (Cancer: Rogue cells and Role of cancer genes) on the KRAS activity websitew6.
Introduction to the activity

student worksheet. Click to
enlarge image
Image courtesy of the
Wellcome Trust Sanger Institute
Communication and Public
Engagement team
The Investigating Cancer presentation (available onlinew6) provides students with an overview of cancer. It introduces the concept that cancer arises due to abnormalities in DNA sequence, explains the various causes of these mutations and introduces the worksheets and activity. Several sections of the presentation encourage student discussions (see the presentation notesw6).
In the first part of the activity, students identify differences between KRAS gene sequences in healthy and tumour cells on their worksheets, and mark these on the KRAS banner orgene sheet.
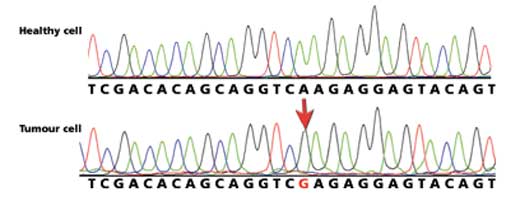
The worksheets have raw KRAS DNA sequencing traces from healthy and cancerous cell samples, represented as coloured line plots – one for each region of the gene. The four bases are represented on these plots by four different colours. Each coloured peak represents an individual DNA base:
Red: T
Green: A
Blue: C
Black: G (normally these peaks are yellow but this is not easy to read on paper)
There are 11 numbered worksheets in total, each showing two different regions of the KRAS gene. The six mutations founding the KRAS gene are on sheets one to six, so be sure to mix the sheets up before distributing them to the class. All must be completed to ensure full coverage of the gene. It is important to point out to the students that mutations are (relatively) rare, so not everyone will find one; this can be used to explore the importance of negative data and comprehensive coverage in scientific studies.
Identifying the mutations
sequence mutations. Click to
enlarge image
Using the worksheets, the students will compare a section of DNA sequence from a healthy cell and a tumour cell from the same patient. The easiest way to identify whether a mutation has occurred is to write the DNA sequence below the coloured peaks (there is a colour key on the sheet to help) and to compare the written sequences.
If one of the letters is different (a peak has changed colour), this indicates a mutation in the sequence. In Figure 7 (right), the A in the DNA sequence from the healthy cell has been replaced by G in the tumour cell.

regions that have been
checked and marking any
mutations
Image courtesy of the
Wellcome Trust Sanger Institute
Communication and Public
Engagement team

mutation. Click to enlarge
image
Images courtesy of the
Wellcome Trust Sanger Institute
Communication and Public
Engagement team
If the students find a double peak at one base position, this should be recorded with the two alternative bases at that position, one above the other. In Figure 8, the healthy DNA sequence has a G, whereas the tumour sequence has both G and C. This is not an insertion: it represents a heterozygous mutation where only one copy of the gene has substituted a C for a G. In this case the tumour sequence has replaced G with a C.
All students should indicate the gene regions they have checked by ticking off the relevant region on the gene sheet (see Figure 9).
Students who find a mutation should indicate the specific base by circling it on the gene sheet (see Figure 9, left) and make a note of which codon this lies in (in this example, codon 12).
They should also fill in the table at the base of the worksheet, using the codon wheel to translate the DNA sequence into the amino acid, as shown in Table 1:
| Amino acid number | Healthy cell DNA sequence; | Tumour cell DNA sequence | Healthy cell amino acid | Tumour cell amino acid |
|---|---|---|---|---|
| 12 | GGT | GTT | Glycine (G) | Valine (V) |
When all mutations have been found, record them on the summary data sheet (see Table 2).
| Amino acid number | Healthy cell DNA sequence | Tumour cell DNA sequence | Healthy cell amino acid | Tumour cell amino acid |
|---|---|---|---|---|
| 12 | GGT | GTT | G (glycine) | V (valine) |
| 13 | GGC | GAC | G (glycine) | D (aspartic acid) |
| 30 | GAC | GAT | D (aspartic acid) | D (aspartic acid) |
| 61 | CAA | CGA | Q (glutamine) | R (arginine) |
| 146 | GCA | CCA | A (alanine) | P (proline) |
| 173 | GAT | GAC | D (aspartic acid) | D (aspartic acid) |
Discussing the results
The results above are all single base substitutions. These mutations within the protein-coding region of the KRAS gene may be classified into one of three types, depending on the information encoded by the altered codon.
- Silent mutations code for the same amino acid.
- Missense mutations code for a different amino acid.
- Nonsense mutations code for a stop and can truncate the protein.
Discuss whether the mutations are significant – will they have an impact on protein function or are they ‘silent’? In this activity, codons 30 and 173 are silent and therefore do not have a functional impact.
| Amino acid number | Healthy cell DNA sequence | Tumour cell DNA sequence | Healthy cell amino acid | Tumour cell amino acid | Type of Mutation | Significant yes / no |
|---|---|---|---|---|---|---|
| 12 | GGT | GTT | G (glycine) | V (valine) | Point (missense) | yes |
| 13 | GGC | GAC | G (glycine) | D (aspartic acid) | Point (missense) | yes |
| 30 | GAC | GAT | D (aspartic acid) | D (aspartic acid) | Point (silent) | no |
| 61 | CAA | CGA | Q (glutamine) | R (arginine) | Point (missense) | yes |
| 146 | GCA | CCA | A (alanine) | P (proline) | Point (missense) | yes |
| 173 | GAT | GAC | D (aspartic acid) | D (aspartic acid) | Point (silent) | no |

representation of the KRAS
protein. Amino acids 12
(blue), 13 (yellow), 61
(orange) and 146 (pink) are
those which carry mutations
Image courtesy of the
Wellcome Trust Sanger Institute
Communication and Public
Engagement team, created with
RasMol
The presentation has a 3D space-fill image of the KRAS protein (Figure 10, right); slides 26–30 show where on the protein the significant mutations are, and you will notice they are all in the same region. Codons 12, 13 and 61 were the first mutations to be associated with oncogenic transformation in the KRAS protein; mutation 146 was only discovered in 2005. Use these slides to discuss the impact that the mutations could have on protein structure and KRAS’s function in growth signalling.
As an optional activity, the students can use RasMol, the molecular modelling software used to create the images on slides 26–30, to highlight the mutated amino acids in the protein structure. See the teacher notesw6 for details.
How does information like this influence our approach to cancer?
The teacher notesw6 contain a wealth of background information, using KRAS as an example, to stimulate discussion on how genomic information can be used to further our understanding of cancer and develop cancer treatments. Discussion points for students include:
- What experiments or approaches could be used to establish which cancers involve KRAS mutations?
- What could be the advantages of knowing this information?
- Cancer is a genetic disease: it is a result of changes in the DNA sequence. This is why many people believe that significant funding of research into cancer genetics is the best way of developing new cancer treatments and thus dealing with the disease. Cancer treatment and care for patients also requires large amounts of money (the UK National Health Service spent more than £2 billion on cancer care alone in 2000). Where and how do students think money should be spent?
Web References
- w1 – Learn more about the Cancer Genome Project at the Wellcome Trust Sanger Institute here: www.sanger.ac.uk/group/cancer-genome-project
- w2 – To learn more about the Wellcome Trust Sanger Institute in Hinxton, UK, a leader in the Human Genome Project, see: www.sanger.ac.uk
- The institute offers visits for school classes, teachers and the general public, as well as teacher support and further opportunities to get involved. See: https://publicengagement.wellcomeconnectingscience.org/
- w3 – The Yourgenome.org website was launched by the Sanger Institute to stimulate interest in and discussion on genetic research. It includes a section of varied and well developed resources for teachers, including the activity presented in this article. See: www.yourgenome.org
- w4 – The European Learning Laboratory for the Life Sciences (ELLS) at the European Molecular Biology Laboratory provides continuing professional development courses (LearningLABs) in molecular biology for European secondary-school science teachers. In March 2010, ELLS ran the first bioinformatics LearningLAB for teachers at the European Bioinformatics Institute in the UK. For information on ELLS courses, please go to: www.embl.org/ells
- w5 – To find out more about the European Bioinformatics Institute, see: www.ebi.ac.uk
- w6 – To download all materials for the KRAS activity and for more background information, see: www.yourgenome.org/teachers/kras.shtml
Resources
Websites for student reference and discussion
- The Cancer Research UK website offers accessible information on all the major cancers and current research. See: http://info.cancerresearchuk.org/cancerandresearch
- The New Scientist website has an area focusing on cancer, featuring the latest articles on cancer research developments and interactive animations demonstrating targeted cancer drug functions. See: www.newscientist.com/topic/cancer
- Nature Milestones in Cancer offers a collection of selected review-type articles and an online library of recent research papers from Nature Publishing Group, available for download as PDFs. It also has a cancer timeline showing major milestones in cancer research. See: www.nature.com/milestones/milecancer
- The Inside Cancer multimedia website created by the DNA Learning Center offers a multimedia guide to cancer biology, diagnosis and treatment. See: www.insidecancer.org
Recent news articles
- The BBC News website has published an interesting article on how newly discovered genetic hotspots for bowel cancer might help doctors to treat the disease better. See: http://news.bbc.co.uk or use the direct link: http://tinyurl.com/28o7zgf
- Sample I (2009) First cancer genome sequences reveal how mutations lead to disease. The Guardian. See www.guardian.co.uk or use the direct link: http://tinyurl.com/yeknj5x
- Roberts M (2009) Scientists crack ‘entire genetic code’ of cancer. BBC News. See http://news.bbc.co.uk or use the direct link: http://tinyurl.com/yb59qcz
- This article includes a video interview with Professor Mike Stratton, leader of the Cancer Genome Project.
Further reading
- Friday BB, Adjei AA (2005) K-ras as a target for cancer therapy. Biochimica et Biophysica Acta – Reviews on Cancer 1756(2): 127-144. doi: 10.1016/j.bbcan.2005.08.001
- Futreal A et al. (2004) A census of human cancer genes. Nature Reviews Cancer 4: 177-183. doi: 10.1038/nrc1299
- The author version of this paper can be freely viewed online. See: www.ncbi.nlm.nih.gov/pmc or use the direct link: http://tinyurl.com/3x5hah6
- For a full catalogue of somatic cancer genes (COSMIC) described in the above paper and created by the Cancer Genome Project, see: www.sanger.ac.uk
- Stratton MR, Campbell PJ, Futreal AP (2009) The cancer genome. Nature 458: 719-724. doi: 10.1038/nature07943
- Download the article free of charge here, or subscribe to Nature today: www.nature.com/subscribe
- For more information on how genetic mutations cause diseases, see:
- Patterson L (2009) Getting a grip on genetic diseases. Science in School 13: 53-58. scienceinschool.org/2009/issue13/insight
- For an interview with cancer researcher Joan Massagué, see:
- Sherwood S (2008) On the trail of a cure of cancer. Science in School 8: 56-59. scienceinschool.org/2008/issue8/joanmassague
- For a classroom activity to discuss the ethics of knowing what your genes have in store for you, including the possibility of cancer, see:
- Strieth L et al. (2008) Meet the Gene Machine: stimulating bioethical discussions at school. Science in School 9: 34-38. scienceinschool.org/2008/issue9/genemachine
Review
The teaching activities described in this article aim to actively involve advanced secondary-school biology students in a search for mutations that could potentially lead to cancer development, using real genomic data. The procedure is not a truly experimental one, so no real laboratory instruments are needed. Instead, the search is a theoretical one based on authentic data. All materials required to run the activity along with detailed directions can be freely downloaded from the programme website.
Apart from describing the various steps of the activity, the article and the supporting website include important information on what cancers are, what causes them, how they develop and how genomic information can be useful in developing treatments. Furthermore, several discussion points are suggested to enhance students’ understanding of cancer.
Michalis Hadjimarcou, Cyprus