Supporting materials
Step-by-step procedure to follow (PDF file)
Images of the spectra (PDF file)
Tables for teachers (Excel file)
Tables for pupils (Excel file)
Download
Download this article as a PDF


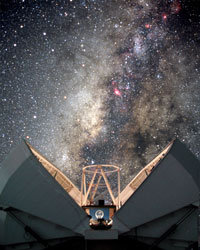
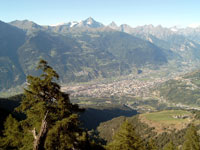
On 26 December 2013, after a long and exciting trip, 56 secondary-school students from 18 countries arrived at their destination: the picturesque alpine village of Saint-Barthélemy, Italy, where the Astronomical Observatory of the Autonomous Region of the Aosta Valley (OAVdA) was built because of…
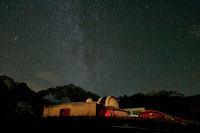
On 26 December 2013, a time of year when the nights are long and clear in the Alps, 56 secondary-school students from 18 countries arrived at their destination: the picturesque alpine village of Saint-Barthélemy, Italy, dazzlingly bright under a fresh sprinkle of snow.
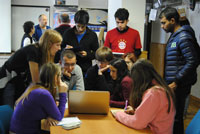
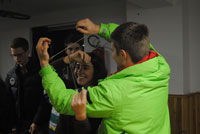
The participants quickly got to know each other, shared stories and were soon laughing together. They were all eager to start this unique week at the first ESO Astronomy Campw1, hosted by the Astronomical Observatory of the Autonomous Region of the Aosta Valley (OAVdA).
On the first evening, a world map was hung in the lecture room and everyone marked their home country. With all the labels, the map looked very colourful — exactly like the Universe that the curious students were going to learn about.
The camp programme explored the theme of the visible and the invisible Universe through lectures, hands-on activities, and night-time observations with telescopes and instruments at the observatory.
Social activities, winter sports, a planetarium show and multicultural tea-time meetings contributed to making the camp a memorable experience for the participants.
Part of their excitement came from the opportunity to spend time with professional astronomers, who not only shared their knowledge and enthusiasm with the students during the activities but were also so overloaded by questions during meal times that they had little chance to eat the delicious food prepared by the hostel staff!
The programme began with an introduction to visible light and an explanation of how to interpret the light arriving from the stars to calculate their temperatures.
The spectrum of a star is an absorption spectrum: the stellar photosphere – the thin layer where the stellar gas undergoes the transition from opaque to transparent and where light can escape into space – emits light at all wavelengths, but some specific wavelengths are absorbed by the elements at the star’s surface. This absorption creates dark lines of missing wavelengths on the spectrum.
In addition, the colour of the star – or, to be more precise, the maximum brightness of the spectrum – depends on the temperature of the stellar photosphere: it shifts towards blue if the star is hotter, and towards red if it is cooler, as explained by the black body laws (see box below).
The black body laws state that a hot, dense and opaque gas emits a continuous spectrum of wavelengths whose maximum brightness moves towards shorter wavelengths when the temperature increases. Because blue light has a shorter wavelength than red light, the colour we see for a star shifts from red for colder stars to orange, yellow, white (when the peak of brightness is in the green, stars actually look white) and finally blue for hotter stars.
More precisely, the specific wavelengths absorbed by the elements at the surface of the star correspond to the quantity of energy that the electrons in the atoms of those elements need in order to reach a higher level of energy. The energy levels that the electrons occupy change from atom to atom and also depend on the temperature of the gas.
Because different stars have similar chemical compositions, the absorbed wavelengths depend mainly on the temperature. So, in a first approximation, we can consider that both the colour of a star and the dark lines on its spectrum depend on its temperature. Colour and lines are correlated: blue stars show certain lines and red ones others.
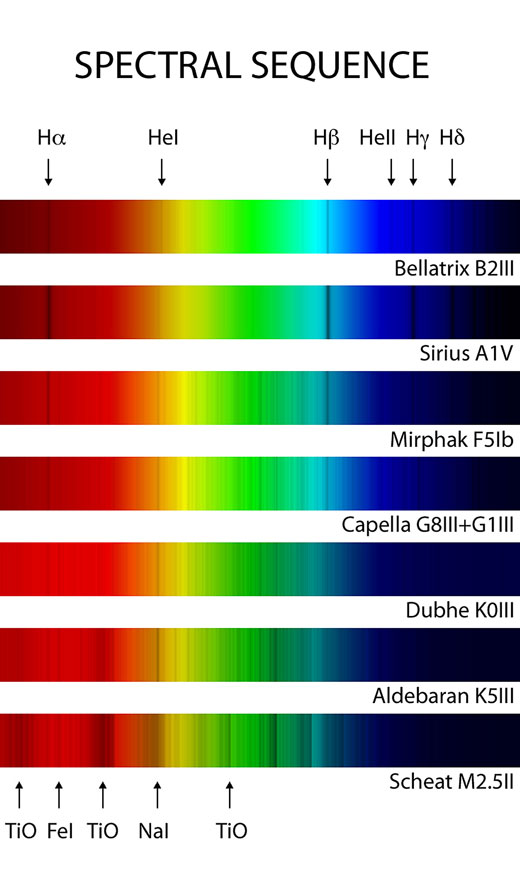
Astronomers understood this crucial correlation in the second half of the 19th century, and established so-called spectral classifications. The most important one, named the Harvard Classification, was created at the beginning of the 20th century and is still in use today with very few changes.
The Harvard Classification contains seven major classes: O, B, A, F, G, K and M, in order of decreasing temperature:
Each class is further divided into 10 types, indicated by numbers from 0 to 9, where 0 is the hottest and 9 the coldest. So we have stars that are type A0 (Vega), G2 (Sun) and K5 (Aldebaran), for example.
Moreover, starts of the same temperature can have different radii and luminosities. To reflect these variations, a luminosity classification with Roman numerals complements the Harvard Classification:
Luminosity also has a slight impact on spectrums, but this was not explained in detail at the camp.
The correlation between star colour and spectral lines means that each class in the Harvard Classification is characterised by lines that are typical of the temperature of that class:
On the first day, students were asked to choose their favourite star from a photo of the winter sky, and to calculate its temperature and maximum emission based on its tabulated spectra.
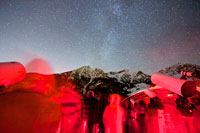
In the evening, groups of students were able to operate a spectrograph and a charge-coupled device camera attached to one of the didactical telescopes, and to capture the spectra of several favourite stars, among them Aldebaran, Betelgeuse, Dubhe, Mirphak and Sirius.
These newly observed spectra were then used on the following day to calculate the temperatures of the stars and to classify them. The students proved to be excellent team-workers. You can download the step-by-step explanation of how to implement this activity in your classroom, together with the spectra of several stars, from the Science in School websitew2.
Lecture after lecture and activity after activity, the astronomers opened new windows on the Universe by letting the students see it in a different light. Curiosity was in the air, and questions were raised and answered about the infrared, radio, ultraviolet and X-ray Universe.
Several other activities based on healthy competition were used to help foster teamwork. The Antares competition, for example, challenged the students to use absorption lines in spectra to classify a number of famous and less famous stars according to the Harvard Classification scheme. The non-oven microwave technology tournament was another activity that engaged six groups in measuring what direction the specific signal received by an antenna came from.
The camp concluded as the International Space Station passed above our heads, an unforgettable traditional gala dinner and astronomical gifts and awards from ESO. Time flew by but the memory of the camp activities and friendships will last forever. We are already looking forward to next year’s campw3!
The camp was a wonderful experience. Meeting so many people from other cultures with different ways of thinking and the chance to discuss hot topics with them was unique and exciting.
Gabriele, 16, Italy
I am not exaggerating when I say that the night observations were the most exciting part of the camp! We scrutinised stellar spectroscopy together with the observatory staff — one of the most interesting parts of astronomy for me. […] I’m sure what I learned at the ESO Camp will be useful for my future education.
Daniil, 16, Russia
[…] We soon settled into a wonderful routine of astronomy-related lectures and activities interrupted only by meals and winter excursions. […] By the end of the camp I had experienced some of the best days of my life.
Hera, 16, Sweden
Special thanks go to the camp supervisors Emily, Koen, Lorenzo and Mariona (also for the blog text and photos), and to the camp astronomers for their fantastic lectures and activities: Davide Cenadelli (Observatory of the Aosta Valley), Enzo Bertolini (Observatory of the Aosta Valley), Lars Lindberg Christensen (ESO), Andrea Bernagozzi, Paolo Pellissier and Paolo Recaldini (Observatory of the Aosta Valley), Anna Wolter (ESO/INAF), Juan Fabregat (University of Valencia), Aniello Mennella and Paola Battaglia (University of Milan).

As a teacher, one can sometimes come across opportunities available to 16 years old that make one regrets not being 16 years old anymore.
This article promotes the ESO, European Southern Observatory, Astronomy camp, an amazing occasion that some 16 year old students, from any European country, attended in December 2013. This camp balanced exciting astronomical observations and learning from professional astronomers with a healthy sports and social program.
For teachers, this article is an excellent and complete resource to use during an astrophysics lesson for 16 to 18 years old. For younger students, it provides a good introduction to stars classification. The stimulating part of this article is that it offers an easy-to-follow procedure to calculate the surface temperature of stars by analysing their spectra using real data, which is always an added plus to a lesson. It also exposes some of the challenges faced when calculating these temperatures, a possible extension to the work.
Looking at the web references given in this article, I could see that another ESO astronomy camp is planned for this December 2014. Oh, to be 16 again!
Dr Caroline Neuberg, Fulneck School, UK