Supporting materials
Download
Download this article as a PDF


Use equations of motion to work out what happened in a car crash – and learn some valuable life lessons.

Living in a rural area in Scotland, many of our students learn to drive on their farms – and believe they have little to learn when they begin driving on public roads. As a result, there have been many road fatalities involving young people in our region. In response to these shocking events, we devised a school-based activity to make students who are approaching driving age more aware of the dangers involved in driving – to themselves, other drivers and pedestrians. The activity also encourages students to apply the equations of motion they have learned in physics to a real-life situation relevant to their own lives.
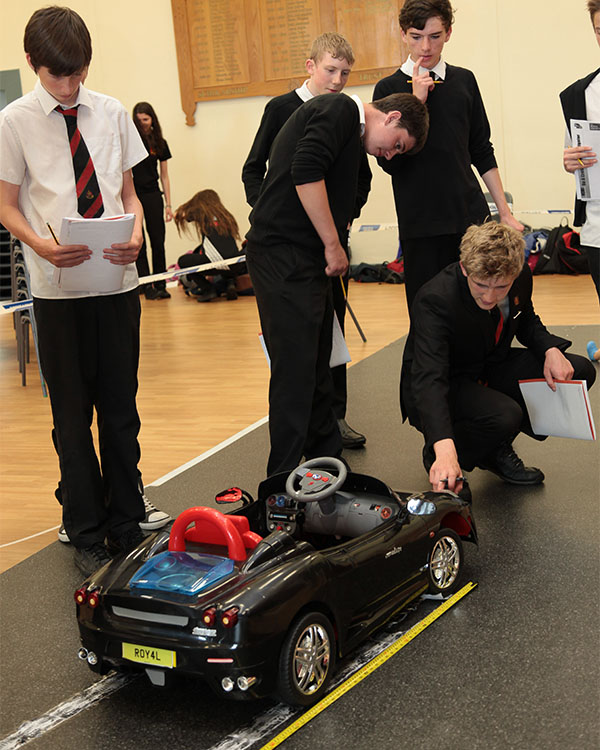
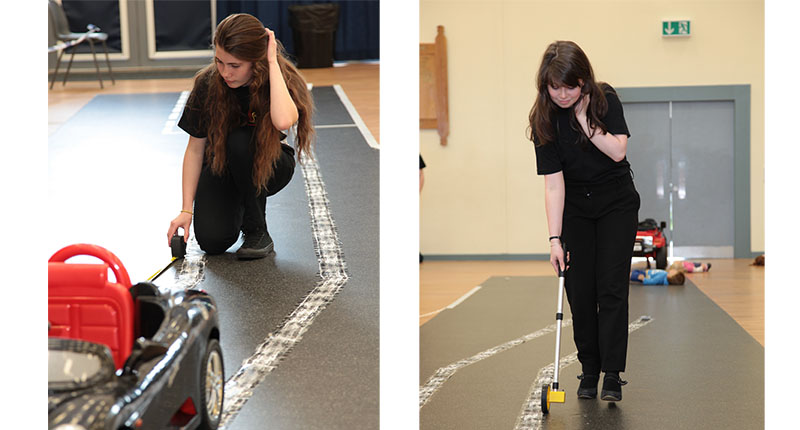
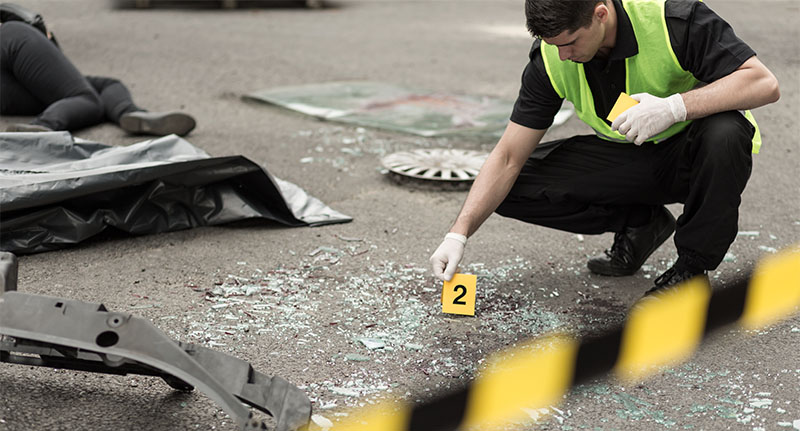
In the activity, we mock up a crash scene based on an actual collision between a car and pedestrian that occurred locally, resulting in serious and life-changing injuries to the pedestrian. The exact details of what happened during the crash are not known: the driver of the car ran from the crash scene, and witness statements were somewhat inconsistent. Students therefore try to reconstruct the incident, using measurements and other evidence from the crash scene, witness statements and calculations. The task is to find out the cause of the accident, who was responsible and if any traffic offences (such as speeding) were committed.
Although it is more engaging for the students to investigate the crash scene themselves, students could alternatively be provided with the key values to use in the equations (particularly the length of the skid marks after the pedestrian was hit), so the activity becomes a straightforward calculation exercise using equations of motion.
The activity is suitable for students aged around 13–17, depending on their maths skills. The version of the activity described here is based on UK roads with UK speed limits, but the details can be adapted for roads in other countries. You could also invent different scenarios relevant to your region: perhaps ask local police if they can provide data from actual traffic incidents in your area.
We asked students to consider the following scenario, and also used it as a basis for building the crash scene:
A pedestrian was hit on a quiet urban road, lit by streetlights and with a 30 miles per hour (48 km/h) speed limit, near a pub at about 10.20 pm on a rainy night. The driver fled the scene. The pedestrian was left unconscious in the road. Although witnesses saw what occurred, parts of their reports were contradictory. One thought the pedestrian might have been drunk, while the other thought the driver was exceeding the speed limit.
Building a crash scene for students to investigate can take up to six hours.
Optional extras:
This part of the activity will take around two hours (or more, if the extension task is included).
Ensure that the students also read the witness statements, which pose the question: was the driver exceeding the speed limit when the crash occurred?
For the calculations, students will also need a value for the deceleration of the car when the driver slammed on the brakes. To find this, a skid test would be performed by the police: they drive the crash car (or a near-identical one) along the same stretch of road in similar weather conditions and perform an emergency stop. An accelerometer on board the vehicle gives values for the acceleration, and the tests are continued until two results are obtained that are within 10% of each other. The lower result is used for any subsequent calculations of the driver’s speed: this is in fairness to the driver, giving them the benefit of any uncertainty.
For this scenario, students can use the following results from the two deceleration tests:
The students now have all the information they need to answer the questions below. Here, we use the measurements obtained in our own simulation, but yours can be based on your own data, ideally obtained from actual road incidents.
Question 1: What speed was the car travelling at when it started to skid?
To calculate the velocity or speed of the car when it started to skid, we use the equation:
v² = u² + 2as
where:
v = final velocity = 0 m s-1
u = initial velocity = ?
a = acceleration = –6.80 m s–2 (lower result from police skid tests)
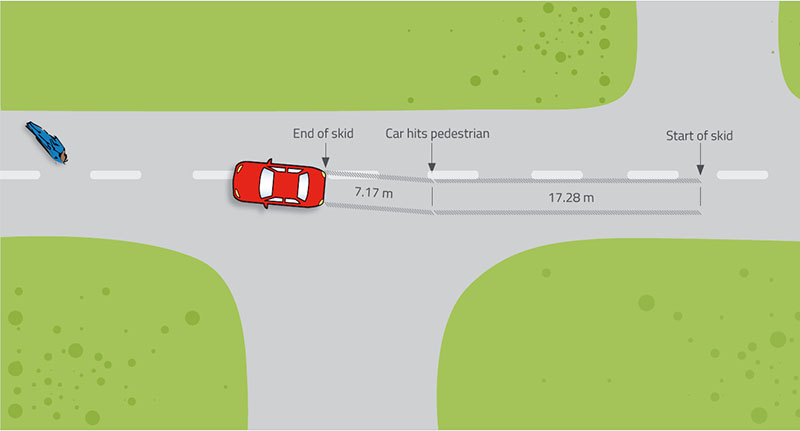
s = displacement (total length of the skid mark, measured at 24.45 m)
Using the equation:
0 = u² + (2 x –6.8 x 24.45)
u² = 332.52
So u = 18.2 m s–1, or 65.6 km/h (approximately 41 miles per hour)
Question 2: What speed was the car travelling at when it collided with the pedestrian?
To calculate the velocity or speed of the car when it collided with the pedestrian, we use the same equation:
v² = u² + 2as
where:
v = final velocity = 0 m s–1
u = initial velocity = ?
a = acceleration = –6.80 m s–2 (lower result from police skid tests)
s = displacement (length of skid mark after collision with pedestrian, measured at 7.17 m)
Using the equation:
0 = u² + (2 x –6.80 x 7.17)
u² = 97.512 m s–1
So u = 9.87 m s–1, or 35.5 km/h (approximately 22 miles per hour)
Question 3: If the car had been travelling at the urban speed limit, would the car still have collided with the pedestrian?
Again using the same equation:
v² = u² + 2as
u = initial velocity = 13.41 m s–1 (48.3 km/h, or 30 miles per hour)
0 = 13.41² + (2 x –6.80 x s)
13.41² = 13.60 x s
So s = 179.86/13.60
= 13.22 m
Therefore, had the car been travelling at 30 miles per hour (the UK urban speed limit), it would have stopped approximately 4 m short of the pedestrian’s position, and would not have hit the pedestrian.
The situation is similar if the car had been travelling at 50 km/h – the urban speed limit in many European countries.
50 km/h = 13.89 m s–1
0 = 13.89² + (2 x –6.80 x s)
13.89² = 13.60 x s
So s = 192.91/13.60
= 14.19 m
Here, the car would have stopped approximately 3 m short of the pedestrian’s position, and would not have hit them.
From the calculations, students should be able to conclude that the car was exceeding the legal speed limit given in the scenario, so the driver was at fault for speeding. In the real-life case, the driver was charged with dangerous driving. He was sent to jail for eight months and banned from driving for four years, for causing the collision and failing to stop at the crash scene.
We found that all students involved in the activity benefitted from the variety of skills involved – observing, hypothesising, recording, measuring, calculating, drawing conclusions and evaluating them – and it successfully engaged students who might otherwise think that physics is not for them. Were lessons also learned about why urban speed limits are set as they are? We think so.
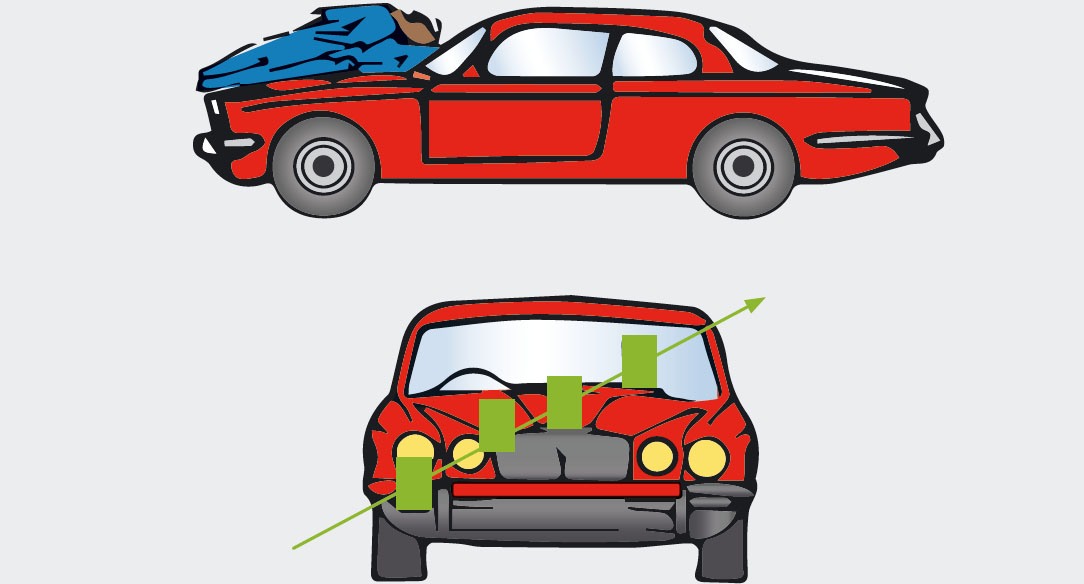
You can extend the activity by adding clues about what happened to the pedestrian when they were hit by the car. In creating the crash scene, use pieces of coloured tape (one colour matching the car, the other matching the pedestrian’s clothes) so students can gather information on how the pedestrian was hit and thrown in the collision (see figure 2).
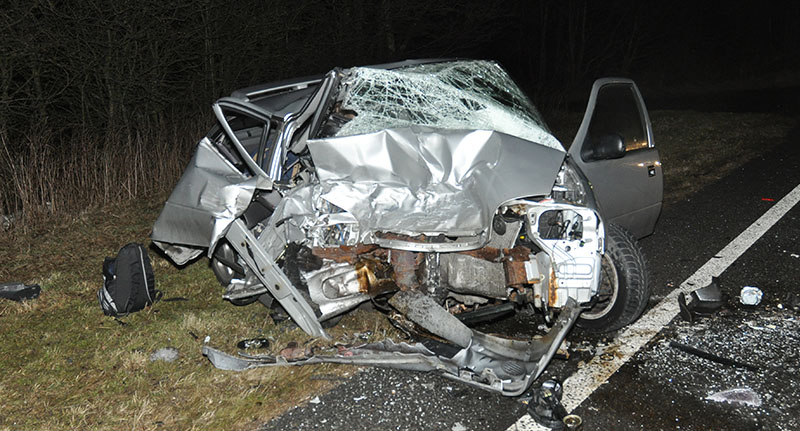
The downloadable document (see additional materials section) on pedestrian collisions provides additional information about what happens to pedestrians in car crashes – shocking details that should encourage students to think further about the risks involved in driving.
The author would like to thank the following people and organisations for their help with this project:
Unfortunately, traffic accidents seem to be a common occurrence in most countries. What better way to try and reduce the number of these incidents than by using science to educate our students to be more responsible drivers?
This activity is relevant for a wide range of ages and can be easily adapted to every country’s driving speed limit. Using a simulation of an actual car accident, students apply the laws of physics to solve some missing pieces of the puzzle and find out for themselves what really happened. This should lead to meaningful discussions about excessive speeding, and factors affecting the ‘thinking’ and ‘braking’ distances. Alcohol or drug consumption, tiredness, and being absent-minded can affect the thinking distance, while conditions of the road, weather and the condition of tyres can affect the braking distance. It is important that students realise that ignoring these facts while driving can have fatal results.
Catherine Cutajar, physics teacher, St. Martin’s College Sixth Form, Malta
Download this article as a PDF