


Smartphones in the lab: how deep is your blue? Teach article
Exploring coloured chemistry using smartphones
When copper is dissolved in an aqueous solution of nitric acid, the solution turns blue. The more copper is added, the more intense the colour becomes. But how can you work out exactly how much copper was used by only looking at the colour?
People know that when you dilute a coloured syrup, it turns lighter. This is because the absorption of light, which produces the colour, is proportional to the concentration of the dissolved colorant (according to the Beer–Lambert law). In this activity, students aged 13–18 test this law using free colour match apps on their smartphones.

This activity is intended for a chemistry lesson, but can be modified for a mathematics class. This activity gives students an opportunity to practice the scientific method. They have a question to answer – how much copper did my teacher dissolve? They must then choose what method to use before taking the measurements, collecting data, organising the data in a table, and making a graph to estimate the amount of dissolved copper.
Here we suggest four different protocols:
- A classic cookbook protocol, which provides all of the details on how to carry it out.
- A protocol for a mathematics class, in which all the solutions have been prepared in advance; the students only make the measurements and carry out the analysis.
- An open protocol, in which the students receive a small amount of information and a question to answer.
- A co-operative protocol, which suggests collaboration between schools.
Chemistry cookbook protocol
The teacher or technician needs to prepare a copper solution of unknown concentration at least one day in advance (see box). After this preparation, the students do the work during the activity, which should take around 1.5 hours.
Making the copper solution of unknown concentration
Safety note
Nitric acid (HNO3) is corrosive, so use gloves, glasses and a fume hood. The reaction of copper produces such large amounts of toxic gases that this must be done in the hood at least one day in advance.
solution
Image courtesy of Science on
Stage
Materials
- 1.5–3.5 g pure copper
- 7.5–17.5 cm3 65% HNO3
- Distilled water
- 50 cm3 beaker
- 100 cm3 flask
Procedure
- Take between 1.5 g and 3.5 g of pure copper (note the exact mass, m(Cu)).
- Pour 5m(Cu) cm3 of 65% HNO3 into a 50 cm3 beaker (e.g. if you took 2 g of copper, use 5 x 2 = 10 cm3 of nitric acid).
- Add the copper (little by little if it is in powder form), close the fume hood and wait until all the copper has been dissolved.
- After the copper is completely dissolved, add dropwise to 30cm3 of water, then transfer the solution to a 100 cm3 flask, dilute with water to 100 cm3 and close the flask. Stir well.
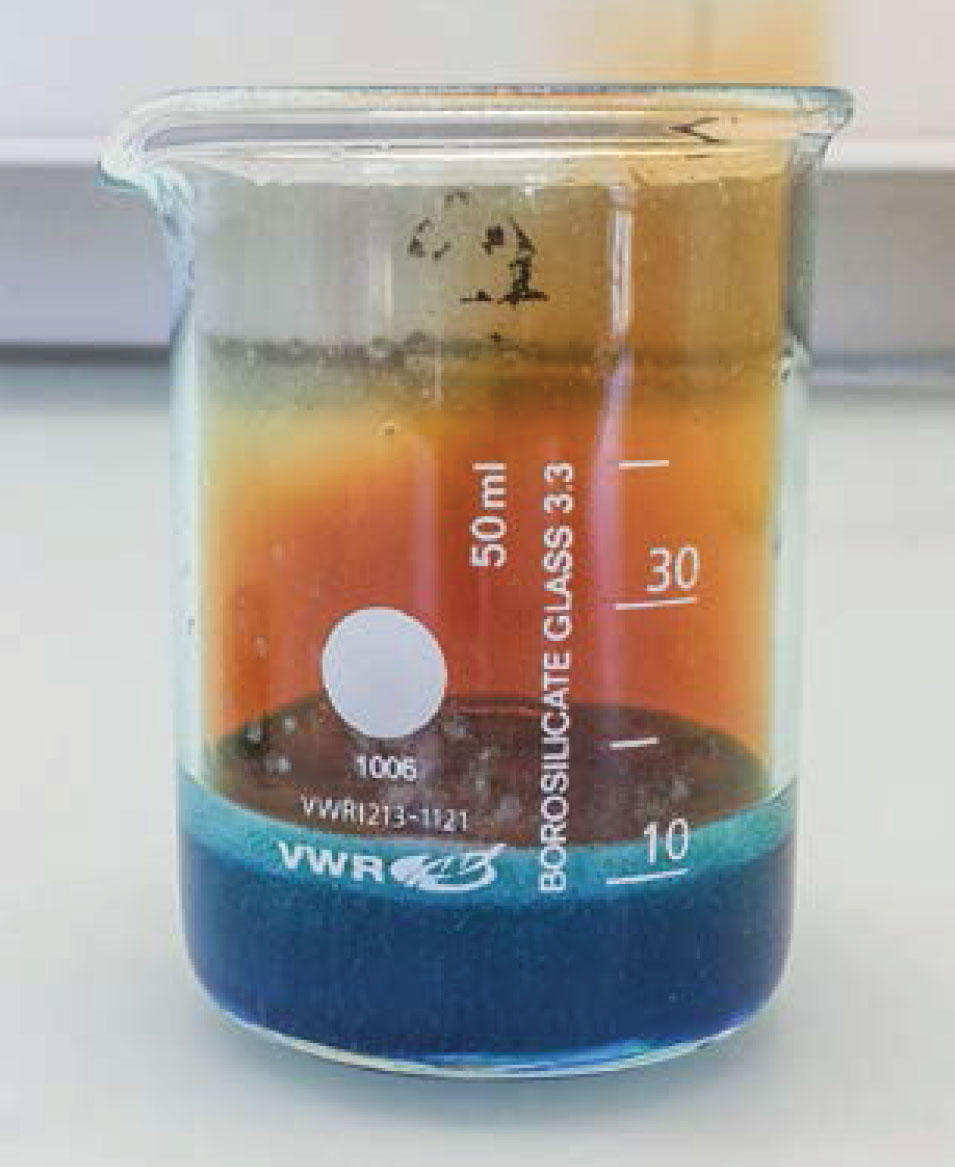
Make the reference scale
Materials
- 30 g copper nitrate hydrate (Cu(NO3)2∙3H2O)
- Distilled water
- Three 100 cm3 flasks
Procedure
- Label the flasks 1, 2 and 3.
- Take each flask and add 5, 10 or 15 g of Cu(NO3)2∙3H2O. Calculate the exact masses m1, m2 and m3 of pure copper in each flask.
- Add water until the total volume is 100 cm3; close the flasks and shake well. This makes the scale with numbers 1, 2 and 3.
Note: You can also replace Cu(NO3)2∙3H2O, which is moisture sensitive, with hydrated copper sulfate (CuSO4·5H2O – do not change the quantities) or anhydrous CuSO4 (use about 3.3 g, 6.6 g and 10 g in this case).
Measure the H-values with a smartphone
Materials
-
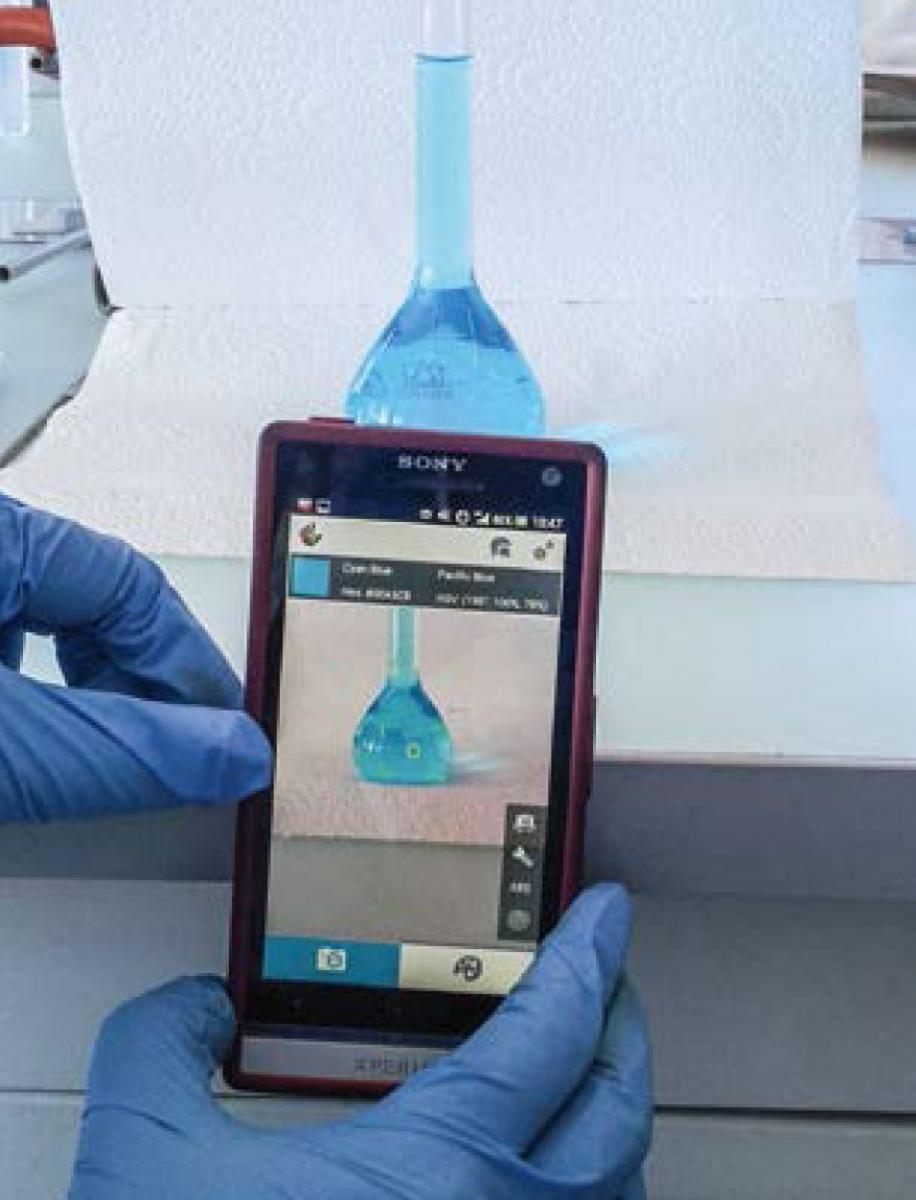
Students measuring the
H-value with the smartphone
Image courtesy of Science on
StageFlasks 1–3 (from the ‘Make the reference scale’ procedure above)
- Smartphone with Color Grab (android) or ColorAssist Free Edition (iOS) app installedw1
- Large sheet of white paper
- Pencil
Procedure
- Put flask 1 on a piece of white paper (the paper should rest against a vertical support so that it forms both a white base and background) and use the pencil to mark the exact position of the flask on the paper.
- Fix your smartphone on the table so that the centre of the camera points at the largest part of the flask (the viewing angle should be horizontal).
The distance between the background and the flask should be about 4 cm, and between the smartphone and the flask should be about 14 cm. - Use the app on your phone to read the H-value (of the HSV or HSL colour model , explained further down in the article) and note it.
- Repeat this with flasks 2 and 3 using the same geometry.
Identification of the unknown solution
- Use the values for m1, m2, and m3 calculated earlier to plot a graph of the H-value as a function of the mass of copper. The H-value is proportional to the concentration of the solute and so this graph should be a straight line.
- Using the protocol as above, measure the H-value of the unknown solution.
- Use your graph to determine the mass of copper in the unknown copper solution.
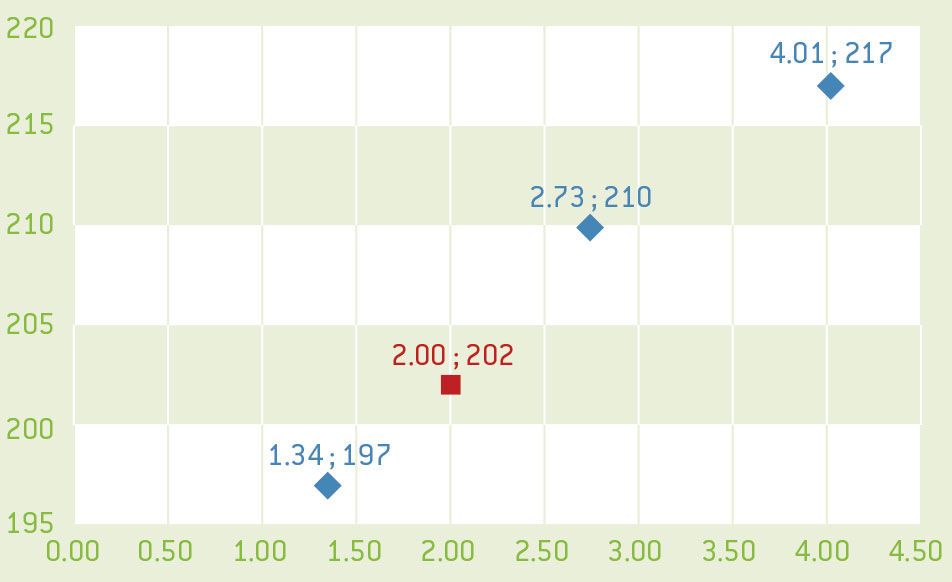
Image courtesy of Science on Stage
Mathematics class protocol
The teacher makes the four solutions in advance as above and labels the reference scale flasks with the equivalent mass of pure copper on the flasks. The equipment that the students will probably need or ask for to carry out a fair test should be prepared. This experiment should easily be completed in around 45 minutes.
Procedure
- Install one of the colour apps on your phone and work out the best way to measure the colour. Try to learn how to pause the measurement and how to use the smartphone’s flash to assist with the measurement.
- Measure the H-values of the solutions in the three flasks, which are labelled with the mass of copper that they contain.
- Draw a graph of the relationship between the H-value and the mass of copper. The more copper the solution contains, the darker it is.
- A fourth flask contains an unknown mass of copper. Measure the H-value of this solution and use the graph to determine the mass of the copper in this flask.
Open protocol
Ask your students to install the app and tell them how to use it. Give them the three flasks with the masses of copper written on them and ask them to devise a fair test to determine the mass of copper in the fourth flask using the H-value.
Co-operation option
The students carry out the experiment and also use their smartphones to make a video that explains how to do the experiment. This video is sent to another class (in the same school or internationally), who should then follow the same protocol.
How the apps work
The colour match apps measure colour using the phone camera and express its values in terms of a colour model (RGB, HSV, LAB, etc.). This can be useful when you want to buy paint of a particular colour: you can measure the colour with your smartphone and ask the paint shop for the same colour.
The RGB system is the most commonly used colour model (it’s how colours are expressed on your computer screen, for example), but these values are not related to the wavelength of the colour. Instead the RGB system uses only one wavelength of each primary colour. The hue value (H) of the HSV or HSL colour model distinguishes between different blues (navy blue, denim blue, cornflower blue, etc.). This value can be used instead of absorption in a certain range of concentrations.
Although we did not try it, we think the same procedure could be used with other coloured solutions (e.g. potassium permanganate or food colouring solution). You would have to identify the range of concentrations for which the H-value is proportional to the concentration of the solution.
We have tried to use this procedure with the well-known red cabbage colour experiment but it did not work because the wavelengths of the different colours of red cabbage do not vary linearly with pH. The app was not even able to differentiate the hues between pH 3 and 10, and could therefore only give us the basic colour of red cabbage (pink, purple, green or yellow) from which we could deduce a range of possible pH values. As we usually do that by eye, it makes no sense to use the smartphone for this purpose.
Acknowledgement
This activity was first developed by Science on Stage and published in their collection of articles on using smartphones in science teaching, iStage 2w1. At a workshop in Vienna, Austria – and later over e-mail and the open-source learning platform, moodle – 20 teachers from 14 European countries worked together to develop 11 teaching units that show how smartphones and apps can be used in maths, physics, chemistry or biology classes.
iStage 2 provides a unique summary of practical examples from all over Europe of how to integrate smartphones in daily classes. The brochure is the second publication of the iStage series that deals with new digital media in STEM classes. It is available online, and in print in English and German, funded by SAP. As well as the print and online versions, the brochure can be downloaded as an ibook.
Web References
- w1 – All of the materials and apps can be found on the Science on Stage website.
Institutions
Science on StageReview
I have seen this demonstration in my school from one of the authors, Marc Montangero. The article is a new approach to teaching the Beer–Lambert law without a spectrophotometer – a smartphone is used instead and so the necessary equipment is very simple. However, a special program has to be installed on any given smartphone.
This activity could be used to begin discussions when teaching molar and mass concentration; the relationship between colour and wavelength; the Beer–Lambert law; and the visible spectrum.
Maurice Cosandey, Ecole Polytechnique Fédérale de Lausanne, Switzerland