


Natural experiments: taking the lab outdoors Teach article
By assembling a ‘backpack laboratory’, you can break away from the lab bench and take tests for starch and glucose into the wild outdoors.
Many teachers like to take their classes on field trips. So why do we usually confine chemistry lessons to the laboratory or classroom? The benefits of outdoor teaching are well documented (Malone and Waite, 2016; Dillon et al., 2006), and include both cognitive and skills-based aspects. It’s also well known that, for most students, solving puzzles is more exciting than reading textbooks or listening to lectures.
For these reasons, we decided to develop an enquiry-based approach to science lessons, where students act as ‘detectives’, first creating their own hypotheses in the classroom, then gathering information outdoors and applying their findings to the hypotheses.
Jan Höper
In this article, we describe an activity focused on measuring the levels of glucose and starch found in plants and fungi. We equip the students with an investigation bag containing everything they need for the chemistry field work. At the end of the activity, the students return to the classroom to discuss their findings.
The activity is suitable for students from 16 years of age, due to the chemistry involved and the sources of error that need to be considered. The whole teaching sequence takes approximately 3–4 hours.
Testing for starch and glucose
To test for starch, we used the iodine test in the form of Lugol’s solution (aqueous potassium iodide and iodine), as this simple test is well suited to taking out of the classroom, and only needs one droplet to produce a result.
Replacing the traditional test for glucose
Traditionally, Fehling’s reaction is used to test for glucose (and other reducing sugars). However, as some of the chemicals involved are environmentally toxic or corrosive, we wanted to replace this test.
Instead, we used glucose test strips designed for urine analysis. These give a semi-quantitative result, providing a more informative, as well as a safer and more convenient, test for field work. We tried out test strips from three different manufacturers, and we recommend using those that show glucose concentrations of up to 5% – for example, the Keto Diabur Test 5000 made by Roche.
Sources of error
Because the test strips are designed for use only with urine, there are some important sources of error that need to be considered when using the strips in other contexts, as they may reduce the accuracy of the readings obtained. These include:
- Colour: the strong colour of some fruits and vegetables can mask the colour of the test result, which has to be compared with colours on a scale to find the glucose concentration.
- Chemistry: plant saps or juices are complex mixtures of molecules and ions, some of which can interfere with the chemical reactions involved in the test. For example, large amounts of ascorbic acid may lower the test result.
- Viscosity: thick liquids can give misleading results as there is more liquid on the test stick, and the glucose molecules take longer to reach the stick as they have further to diffuse.
- Practicality: some test kits have scales that are difficult to distinguish, and some kits measure more factors than glucose (such as ketones or proteins) with up to ten test squares on a strip, which can be confusing for students.
How do glucose test strips work?
In commercially available urine glucose tests, two enzymatic reactions are coupled.
First, glucose is oxidised in a reaction that produces gluconolactone (C6H10O6) and hydrogen peroxide (H2O2):
C6H12O6 + O2 glucose oxidase > C6H10O6 + H2O2
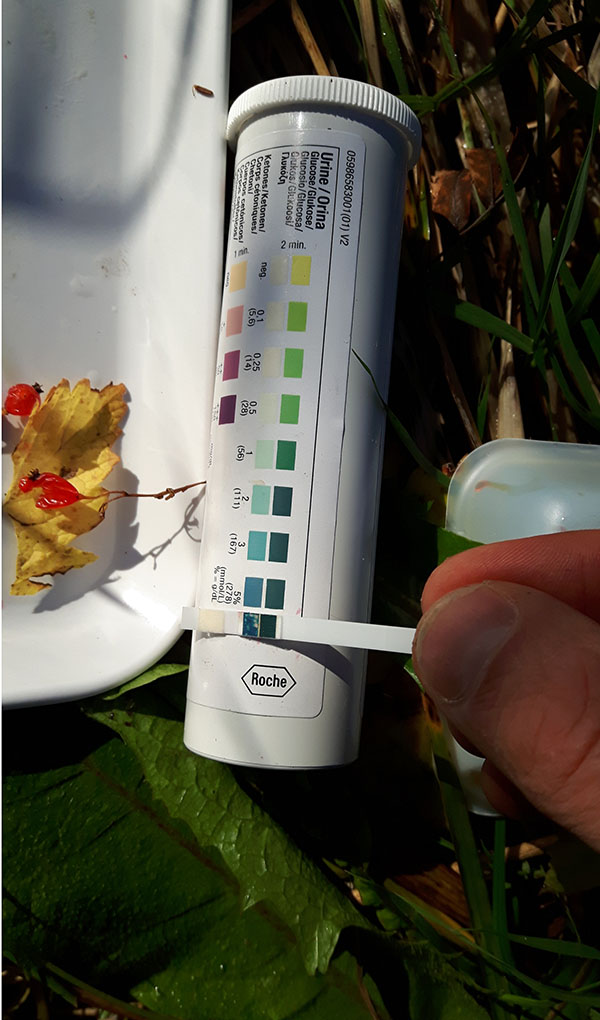
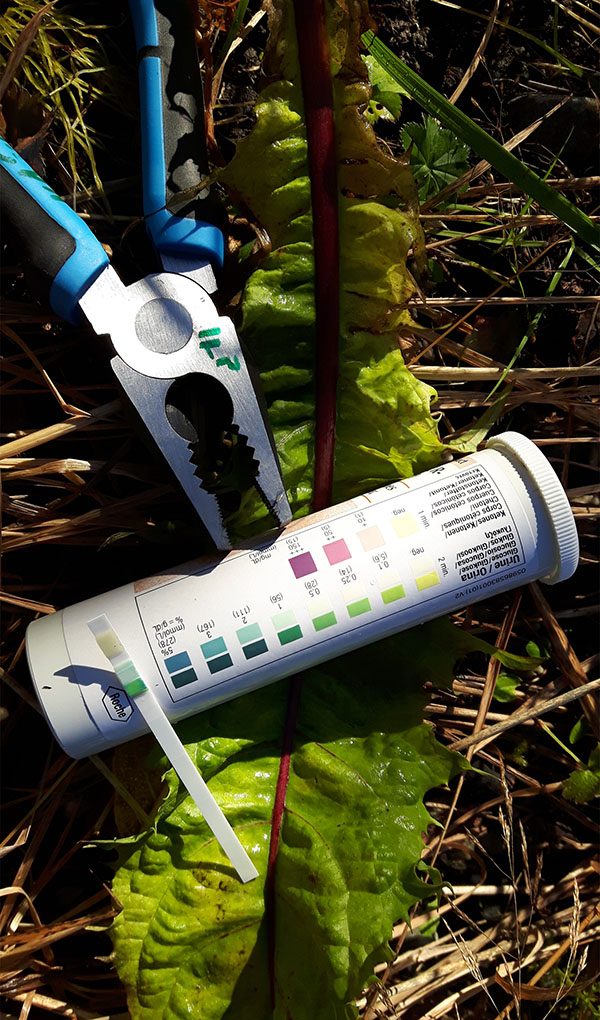
To make the reaction visible, the hydrogen peroxide is then reduced by another enzyme (a peroxidase), and in the process oxidises a chemical substance called a chromogen. The chromogen gradually changes its colour as it is oxidised, so the final colour depends on the amount of glucose originally present.
Finally, to find the glucose concentration, the colour obtained is compared with a row of colour blocks provided in the kit (see figure 1 and figure 2).
Jan Höper
Jan Höper
Phase 1: Learning to use the tests
Working in groups, students learn to use the tests before leaving the classroom. This initial activity takes around 20–30 minutes. The investigation bags should be made up beforehand.
Safety note
When carrying out the starch test, students should wear gloves and safety glasses, as the solution can cause skin and eye irritation.
Materials
-
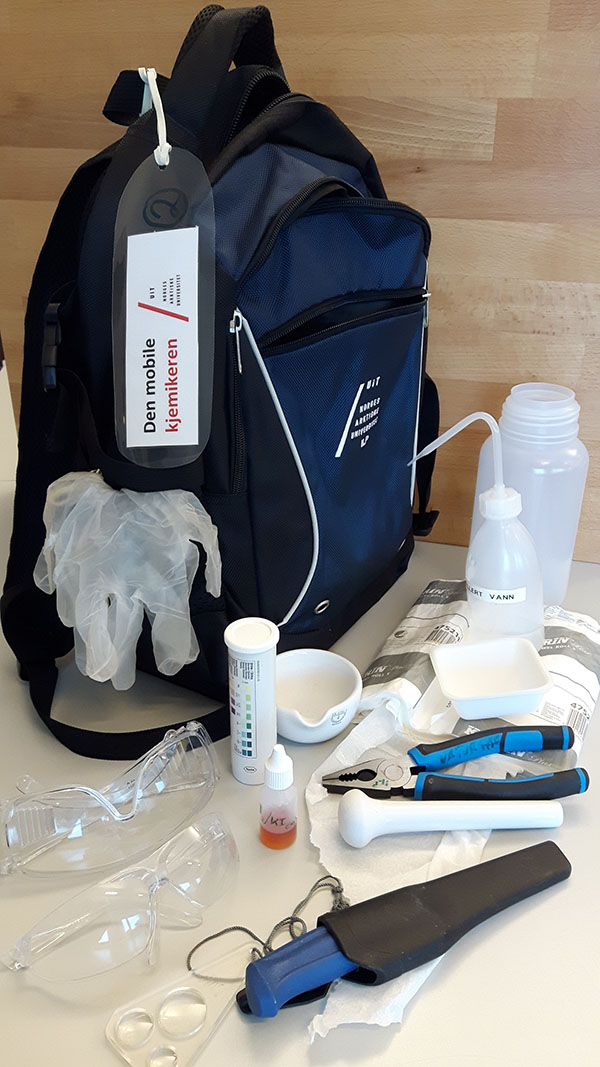
Figure 3: The investigation
bag with its contents for
glucose and starch testing
Jan HöperGlucose (dextrose) in tablet form
- Apple juice, or glucose solutions (e.g. 0.1% (0.1 g/100 ml) and 1% (1.0 g/100ml))
- Food containing lots of starch (e.g. potato, bread), or a starch suspension
- Investigation bags, each of which should contain the following (see figure 3):
- Glucose test strips
- Lugol’s solution (starch test)
- Pestle and mortar (or other small dish) to extract juice from the samples
- Knife (to cut branches or roots)
- Wipes and distilled water (to clean the tools)
- Box for litter
- Magnifying glass
- Cutting board (optional)Gloves and safety glasses
Procedure
- Distribute the investigation bags, providing one bag per group of students.
- Ask the students to read the instructions on the glucose test kits in preparation for conducting a test with the glucose solutions or apple juice. Remind students that the test square should be dipped into the sample liquid for just one second and excess liquid removed. They will need to wait (normally between 30 seconds and 2 minutes) before reading the result.
- For starch testing, place one droplet of Lugol’s solution on the sample under test. The solution will change to black if starch is present, or remain orange-brown if the test is negative.
Phase 2: Deciding on the hypotheses to test
Allow about 20–30 minutes for this discussion phase.
Procedure
- Remind students of what they already know about glucose as the central molecule in cellular respiration, and also as the product of photosynthesis in plants (and thus the basis of the energy flow from producers to primary consumers in ecosystems). In organic chemistry, glucose is the building block of many carbohydrates.
- Set students the task of working as ‘molecule detectives’ who search for answers by detecting glucose and starch in the natural environment. Ask the students, who should work in groups of 3–5, to formulate hypotheses about starch and glucose that they can then investigate. Table 1 below shows some examples of hypotheses, with the reasons why students may propose them – which may be false or invalid.
- Collect and discuss the hypotheses as a class, and task each group with investigating at least one hypothesis. Ideally, each group should have one investigation that will result in a high glucose reading, and one that will result in a low or no glucose reading.
| Hypothesis | Proposed reason |
|---|---|
| Berries have a high concentration of glucose. (True) | They taste sweet. (True) |
| Green leaves contain glucose. (True) | Glucose is the product of photosynthesis, which happens in chloroplasts. (True) |
| Tree resin contains glucose. (False) | It is a waste product of plants. (False) |
| There is a lot of starch in roots and seeds. (True) | Plants store energy as starch. (True) |
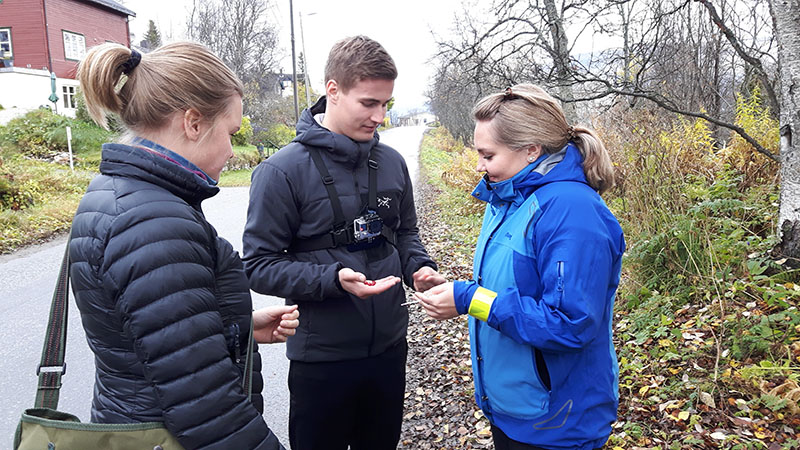
Phase 3: Field work
We suggest 30–60 minutes for the outdoor phase of the activity; the time needed depends partly on weather conditions. Students will need appropriate outdoor clothing, and taking a first-aid kit is a sensible precaution.
Before the field work begins, check the location where the students will carry out the investigation, and consider the season. Is the location safe? Are there enough plants, berries and other materials to test, and do your students have permission to pick them?
Jan Höper
Materials
Each group of students will need:
- Investigation bag (as for phase 1)
- Cameras, smartphones and/or notebooks, to record the species investigated and results obtained
- Optional: field guide about common plants in the area
Procedure
- Go with your students to the location, keeping the groups gathered together so that you can answer any initial questions.
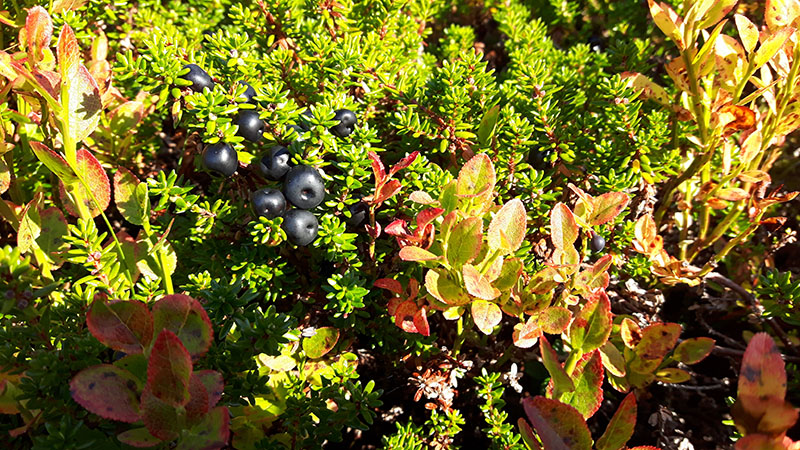
- Working in groups, students gather samples to test their hypotheses. Samples may include any of the following:
- Berries
- Leaves
- Roots
- Stems
- Flowers
- Seeds
- Tree bark
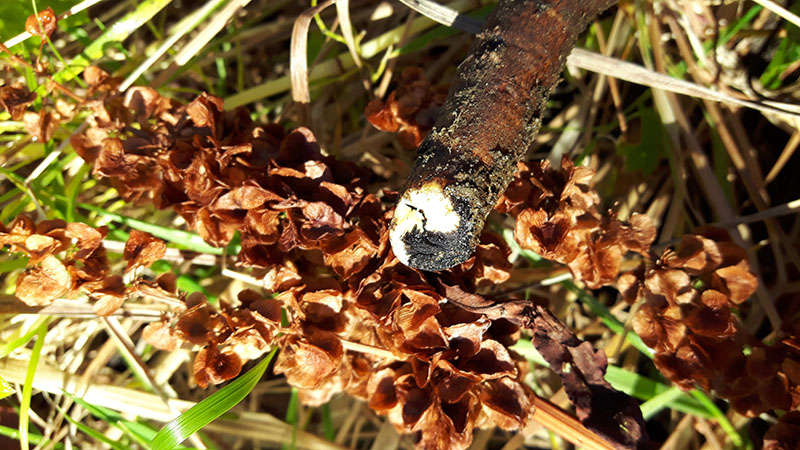
- Wood (from tree branches and twigs)
- Students test their samples for glucose and starch using the equipment in the investigation bag. When testing for starch, use the magnifying glass to see details – for example, in grass seeds.
- Students collect all their belongings and any litter before returning to the classroom.
Jan Höper
Phase 4: Analysis and discussion
Allow at least 45–60 minutes for analysis and discussion back in the classroom. At the start, advise the students not to worry if their results seem inaccurate, as it is just as important to think about the sources of error in the measurements (outlined above) to account for the results they obtained.
Procedure
- First, students write up their field notes and results from the outdoor phase. In their groups, they discuss their results and draw conclusions about their initial hypotheses in a way that can be presented to the class.
- Students then use the internet to find out scientific reference values for the items they tested outdoors. It is quite difficult to find glucose levels for specific plant sources online; see the resources section at the end of this article for suggested websites. Remind students to take extra care when converting units, so that they can compare values from the test sticks to sources on the internet or in books. For some inedible items, students can try thinking of a similar species that is edible and find those values in a nutrient database, as we did with dandelion leaves and lettuce (see table 2).
| Item | Glucose concentration using test strips (%) | Equivalent item from database (USDA)w1 | Database value for glucose concentration (%, as g/100g) |
|---|---|---|---|
| Red currants (very ripe) | c. 5 | Currants, red and white, raw | 3.2 |
| Raspberries | c. 2 | Raspberries, raw | 1.9 |
| Dandelion sap | 0.5–1.0 | Various lettuces | 0.2–0.9 |
The examples here give a realistic idea of the results you can expect: sometimes the values are nearly identical, and in other cases there are large differences.
Jan Höper
Discussion
The whole class should discuss the actual results obtained by each group, their conclusions about their hypotheses, and the comparisons with the databases.
Topics for discussion of the results could include the following:
- Why is there more glucose in berries than in leaves?
- Why is there no starch in berries, but a lot in roots?
Questions relating to the data comparison could include:
- Why are the test results and the database values different?
- How much of this difference is due to measurement errors in the test itself?
- How much of the difference is due to natural variation?
Extension activity… and beyond
As a further research project, students can follow up the discussion about starch to dig deeper into the different carbohydrates produced by plants.
We have extended this outdoor teaching approach to other topics in chemistry, for example: finding different metals and metal ions in the rural or urban vicinity; investigating campfire chemistry; studying the phase transitions of water; and measuring carbon dioxide levels. What other opportunities might there be in your location?

Jan Höper
Acknowledgement
This teaching unit is part of a project called ‘The mobile chemist’, which received financial support from the Department of Education at The Arctic University of Norway. More information about the project is available from the author, who can be contacted at jan.hoper@uit.no
References
- Dillon J et al. (2006) The value of outdoor learning: evidence from research in the UK and elsewhere. School Science Review 87(320): 107-111
- Malone K, Waite S (2016) Student outcomes and natural schooling: Pathways from evidence to impact report 2016. Plymouth: University of Plymouth.
Web References
- w1 – The US Department of Agriculture database provides scientific reference values for a huge range of foods.
Resources
- See the list of ingredients in a banana, showing how complex natural products are.
- Find out more about the iodine test for starch:
- For additional food databases, see:
- Read an academic study of school students’ attitudes to chemistry compared to nature: Krischer D, Spitzer P, Gröger M (2016) ‘Chemistry is toxic, nature is idyllic’ – investigation of pupils’ attitudes. The Journal of Health, Environment & Education 8: 7-13.
Review
In this article, the author confronts the idea that chemistry is often seen solely as a laboratory-based activity divorced from the ‘real world’. A remedy is provided in the form of a chemistry field work exercise, which enables students and teachers to take some fundamental chemistry (usually used in biology lessons) into the field, either as part of the normal curriculum or as a science club activity. Practical work outside a laboratory may require a little more organisation, such as complying with health and safety regulations concerning school field trips, but the efforts will be worthwhile.
Tim Harrison, School Teacher Fellow, University of Bristol, UK