


GIS: analysing the world in 3D Teach article
Earthquakes, global climate or the placement of wind farms – with the help of geographic information systems, these can all be investigated dynamically in the classroom. Joseph Kerski describes how.
GIS: a spatial perspective
/ iStockphoto
For more than 2500 years, people have been fascinated by geography, the study of our planet. Geography is also the science of spatial thinking – how phenomena interact and change over space, at the local, regional and global scale. Today, this spatial science is particularly significant, as issues such as climate change, biodiversity loss, sustainable agriculture, water quality and quantity, energy and natural hazards not only grow in importance but also affect our everyday lives. To grapple with these issues, we need to see patterns and trends at anything from a global scale to the level of a local community.
To investigate such trends, geographers turn to geographic information systems (GIS). Unlike traditional maps, GIS goes beyond static, two-dimensional objects: instead, individual maps can be manipulated and combined with other maps, charts, databases and multimedia.
The G in GIS represents geography – the map: for example, a 2D or 3D topographic map, a map of soil pH, ecosystems, or watersheds, or a satellite image. The I represents the information behind the map, which is stored in a database. For rivers, for example, the information could describe whether the river is perennial or intermittent, or how its conductivity or salinity varies with time or along its course. The S – the system – connects the map and the database. By selecting components on the map, the user simultaneously selects the associated attributes in the database (and vice versa), allowing them to be manipulated.
With the help of hundreds of GIS-specific tools, the data can be manipulated and combined in many different ways. For example, the proximity tool could find all of the earthquakes that occurred within 100 km of Frankfurt am Main, Germany, and the overlay tool could narrow the search down to those earthquakes that occurred under alluvial soil and that are on highly populated land.
Using GIS at school
In schools, GIS can be used not only in geography, but also in biology, chemistry, earth science, environmental science, history, mathematics and other subjects. It can help students at all levels to think critically and use real data, as well as appealing to visual learners.
A wide variety of topics can be explored: the relationships between people, climate, land use, vegetation, river systems, aquifers, land forms, soils, natural hazards and much more. For example, how will climate change affect global food production? What is the relationship between birth rate and life expectancy? How does acid mine drainage in a mountain range affect water quality downstream? How does the changing demography associated with smaller household size affect urban sprawl? What is the best location for new wind energy farms? How will a proposed retail centre affect community traffic patterns and land use?
GIS can be used in three ways.
- Using desktop GIS software, such as the professional software ArcGIS or the freely available programmes ArcGIS Explorerw1 and ArcExplorer Java Edition for Educationw2, students can analyse data they have collected and then stored locally. For example, they could analyse the height and species of trees in their school’s grounds.
- Using GIS via a web browser, students could analyse a much wider range of data, for example, they could use the This Dynamic Planet websitew3 to study the relationship of earthquakes and volcanoes to tectonic plate boundaries and the rate of plate movement. They could use Worldmapperw4 to view the distribution of more than 700 variables online, including forest loss and mineral distribution and extraction, or download the data.
- Finally, students could combine GIS desktop software and its associated tools with data downloaded from the Internet. For example, to analyse the flood potential of rivers in their community and current wildfires around the world using real data and base maps in three dimensions, they could use ArcGIS and also download local satellite imagery and topographic maps from ArcGIS Onlinew5.
Each of the methods has its advantages. Desktop software offers a more powerful analytical toolkit, whereas web-based GIS is easier to use and requires only a web browser.
Below are two examples of analyses with GIS that could be carried out at school.
Analysing recent earthquakes with GIS
Let us say that you have read an article stating that the Haiti earthquake and its aftershocks in January 2010 were unusual because they were large in magnitude and because earthquakes are rare in Haiti. You want to test whether this is true. This can be done with desktop GIS software and data downloaded from the Internet.
- Because earthquakes are inherently 3D phenomena, you will need to download 3D GIS software, for example ArcGIS Explorerw1 (free; for Windows only).
- From the US Geological Survey (USGS)’s seismic cataloguew6, access a comma-separated text file of earthquake data covering January and February 2010. Do this by selecting ‘Earthquakes’ on the left, and then ‘Search for an earthquake’. Run a global search, selecting spreadsheet format (comma delimited), with magnitudes 6 and above (use 10 as the maximum magnitude), from 1 January to 28 February 2010. Copy and save the resulting text data, which will include the dates, locations, magnitudes and depths of earthquake epicentres around the world.
- In a text editor, remove the lines above and below the data except the header line. In the header line, remove the parenthesis and re-save the file.
- In ArcGIS Explorer, use the Tools menu to add your earthquake data as X-Y co-ordinates in their correct locations (see image below).
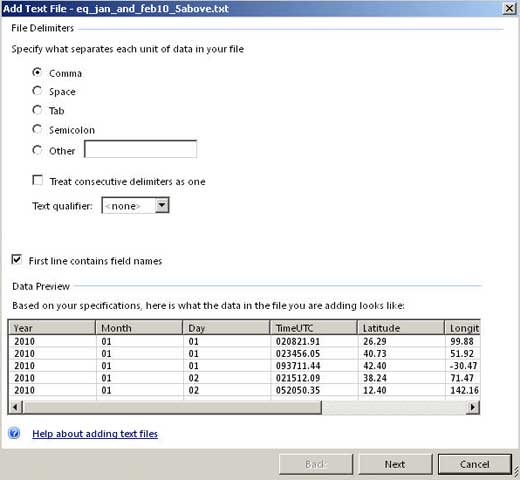
Image courtesy of ESRI
What do you notice about the spatial pattern of global earthquake locations? Why are earthquakes not distributed evenly around the world?
- From ArcGIS Onlinew5, open the plate boundaries layer and the ‘Earthquakes January 2004 to April 2007’ layer in ArcGIS Explorer so that you can investigate the relationship between plate boundaries and the locations, magnitudes and depths of more than 60 000 earthquakes. By clicking on an earthquake, you can see the date, time, magnitude, location and depth of that earthquake (see image below).
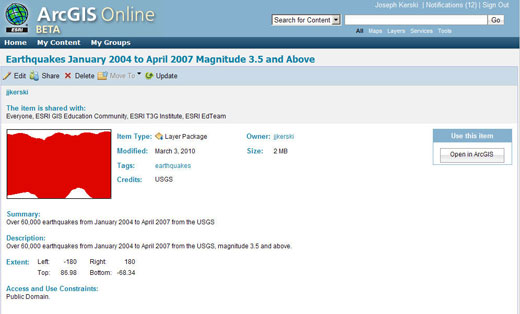
Image courtesy of ESRI
Why are some plate boundaries frequented by earthquakes while others are relatively quiet? Along what type of plate boundaries are the deepest earthquakes? And the shallowest? Why?
You will see that mid-ocean ridges have a moderate number of earthquakes that are less than 10 km deep, whereas subduction zones (where one plate sinks beneath the other) are associated with more frequent earthquakes that are both deeper and more intense.
Zoom to Haiti and you will see that the newspaper article was correct: most earthquakes in the region over the three-year period occurred in a wide, scattered pattern off the northeast coast of Hispaniola (shown by the purple dots in the image below) but the January and February 2010 earthquakes were focused in a narrow cluster on the western side of the island, in Haiti (shown by the yellow dots). Which earthquakes would you consider aftershocks, and why?
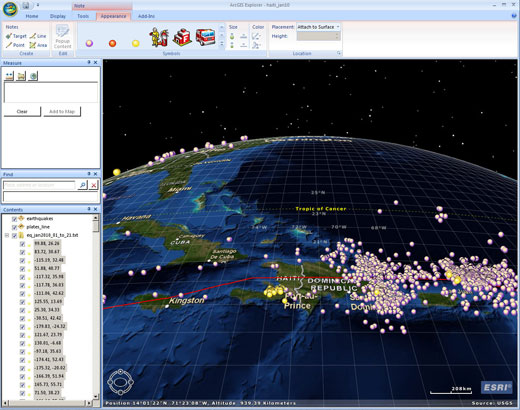
Image courtesy of ESRI
Further questions that the students could address include:
- How and why do plate boundaries differ, and how do their movements result in different kinds and numbers of earthquakes?
- How do plate movements impact populations living in close proximity, and also those far away (through tsunamis)?
- What is the average distance that most earthquakes occur from the subduction zone along the western edge of South America, and what does this distance, and depth of the earthquakes, tell you about the type of plate boundary that exists there?
- Do you think that the fact that there had been no earthquakes in Haiti between 2004 and 2007 contributed to tectonic pressure that resulted in the magnitude 7.0 earthquake of January 2010?
- How common are aftershocks?
- The earthquake a month later in Chile was much larger than the Haiti earthquake, but the death toll was much less. What effect do building codes have on earthquake damage in a region? (See also Marazzi & Tirelli, 2010.)
Analysing world climate with GIS
Another GIS investigation for the classroom would be to analyse world climates.
- Download the free GIS software ArcExplorer Java Edition for Educationw2 (for Windows or Mac).
- Open the worldclimate_hd project to view data layers that include vegetation, maximum and minimum temperature for July, maximum and minimum temperatures for January, mean precipitation, elevation, countries and a 30 degree latitude-longitude grid (see image below).
- Click on the country layer and use the menu that appears to label the countries.
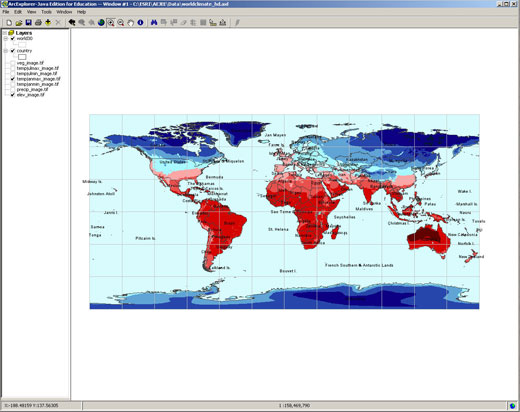
Image courtesy of ESRI
Why is the pattern of maximum temperatures for January different from that for July? From the map, can you see at what time of year it is summer in the northern hemisphere and when it is summer in the southern hemisphere? What influence does latitude have on temperature?
What is the difference between the minimum and maximum temperatures for July? Do any regions of the world experience daily temperature swings of more than 20°C? Where are these regions? What is the effect of the ocean on daily temperature swings and on the maximum temperatures around the world?
- Turn on the elevation map layer (see image below).
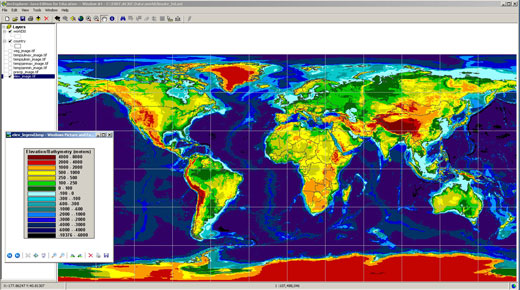
Image courtesy of ESRI
What effect does elevation have on temperature? Is elevation as important as latitude as a determinant of temperature?
- Next, examine the vegetation map layer (see image below).
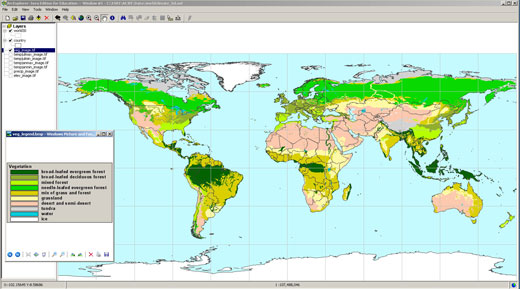
Image courtesy of ESRI
What primary vegetation types cover Gabon, Oman and Japan? How is climate linked to vegetation? What is the predominant vegetation in regions that are more than 2000 m in elevation? Move your mouse until it rests on the Equator, and describe how the vegetation changes as you move across South America, Africa and south-east Asia along the Equator. How does vegetation and climate change as you move north along the Prime Meridian from Ghana to the UK?
Zoom in on the region where you live. Determine the daily temperature variations in January and July and compare the maximum temperatures for January and July for your region.
How does the temperature, precipitation, vegetation and elevation compare with other regions of the world? Is there another part of the world that experiences a similar climate, elevation and vegetation to your region? If so, where is it?
References
- Marazzi F, Tirelli D (2010) Combating earthquakes: designing and testing anti-seismic buildings. Science in School 15: 55-59.
Web References
- w1 – ArcGIS Explorer is free, downloadable 3D GIS software for Windows, with which you can explore, visualise and share GIS information. You can add your own data to your ArcGIS Explorer maps and combine them with free data. You can also customise your maps by adding photos, reports, videos and other information. To download ArcGIS Explorer, watch some demonstrations and learn more about how to use it, visit: www.esri.com/arcgisexplorer
- An evaluation of the professional GIS software ArcGIS can be requested here: www.esri.com/software/arcgis/arcview
- w2 – ArcExplorer Java Edition for Education (AEJEE) is free, downloadable GIS software for Mac and Windows platforms that you can use to examine spatial patterns from a local to a global scale. You can classify, symbolise and analyse maps and images. To download AEJEE, visit: http://www.esri.com/software/arcexplorer/download-education.html
- w3 – Data on volcanoes, earthquakes, impact craters and plate boundaries can be analysed and downloaded from the This Dynamic Planet website. See: http://mineralsciences.si.edu/tdpmap
- w4 – Worldmapper is a collection of maps showing the worldwide distribution of more than 700 variables. The data can be examined visually online or downloaded for further analysis. See: www.worldmapper.org
- w5 – Base maps, such as those showing topography, satellite imagery, streets, and current weather, can be downloaded and integrated into ArcGIS Explorer and ArcGIS projects from the ArcGIS Online website: www.arcgisonline.com
- w6 – The US Geological Survey (USGS)’s Earthquake Hazards Program provides a seismic catalogue from which earthquake data can be downloaded. See: http://earthquake.usgs.gov
Resources
- Connect with other educators using GIS around the world and find lessons, data sets, online mapping tools, software, events and more via the ESRI Education Community: http://edcommunity.esri.com
- Teachers can share and use lesson plans for using GIS via the ArcLessons library. See: http://edcommunity.esri.com/arclessons
- ESRI has published four books containing lessons, data, software and assessment for students of all levels. The lessons include topics in biodiversity, natural hazards and climate, among others. To discover more about these books, see: www.esri.com/ourworldgiseducation
- Gewin V (2004) Mapping opportunities. Nature 427: 376-377. doi: 10.1038/nj6972-376a
- National Academy of Sciences (2006) Learning to Think Spatially—GIS as a Support System in the K-12 Curriculum. Washington, DC, USA: The National Academies Press. ISBN: 0309092086
- Sui DZ (1995) A pedagogic framework to link GIS to the intellectual core of geography. Journal of Geography 94: 578-591. doi: 10.1080/00221349508979371
Review
Everybody has heard about GIS as the ultimate resource in cartography; this article gives teachers the opportunity to exploit this resource for addressing geographic phenomena.
I recommend this article to secondary-school teachers who are willing to investigate more deeply the geographic aspects of earth science (plate tectonics, volcanoes, earthquakes), environmental science (geomorphology, climate, natural resources, pollution, natural hazards), biology (biodiversity, species distribution) and even history (demography, migrations) from the local scale to the planetary level. There are many opportunities for interdisciplinary work.
The use of the proposed software requires some computer skills and it is subject to specific software requirements.
The article would provide valuable background reading before a geological school trip or as a warm-up activity before addressing earth science topics. It could be used as the basis of discussion on many topics related to the subjects mentioned above, in particular, important events such as the recent earthquakes in Haiti and Chile.
Giulia Realdon, Italy