Supporting materials
Download
Download this article as a PDF


Anastasios Koutsos, Alexandra Manaia, and Julia Willingale-Theune bring a sophisticated molecular biology technique into the classroom.
Once upon a time in a small village, there was a man. Every day he went to a pond to catch fish for his dinner. One day it would be a catfish, the next day an eel — sometimes it would be a different fish each day of the week. Then one day he wondered how many different species of fish there were in the pond, and how many of each species. How could he find out? It was obvious that catching one fish at a time wouldn’t work — for all he knew the pond might contain thousands of fish. So he browsed the Internet for ideas and found a book listing 20 000 species of freshwater fish, with the bait used to catch them.
Eventually, he thought of a complex but clever solution: he cast 20 000 fishing lines, each with an array of hooks, into the pond. Using the information from his reference book on fish, he attached a particular type of bait to the hooks on each line to attract a particular species of fish, and in this way created different lines to catch all fish species. The rest was easy: he waited for the fish to find their bait and collected his catch.
[Note – this is a fictitious story: about 9000 species of freshwater fish are known today, and there is not a different bait for each one.]

Now that the draft sequence of the human genome has been published (along with the genome sequences of many other organisms), the challenge is to work out what the individual genes do, and to do so, scientists are designing sophisticated tools. One such tool is the DNA microarray.
Our story of the fisherman is fictitious, but the principles used by the man to find out how many fish there were in the pond are very similar to the principles underlying DNA microarray technology – a technology that has revolutionised the way scientists look at living processes.
Until the 1990s, biologists could measure the activity of only a handful of genes in a cell at any given time. A gene is active when it is being transcribed to its messenger molecule, mRNA, which in turn is used to make one or several proteins.
Frustrated that they could not look at the expression of genes in concert in a single cell, scientists began to search for ways to simultaneously measure the activity of all genes in a cell. To do this, they needed to find out how many different mRNAs were present in a cell at any given time, and which genes those mRNAs corresponded to. It was this revolutionary idea that culminated in the development of DNA microarrays. Those scientists created something similar to the 20 000 fishing lines in our story.
They took a piece of treated glass similar to a microscope slide and immobilised batches of single strands of DNA on its surface, each batch corresponding to a single gene. These DNA strands could then act as bait to attract the corresponding mRNA molecules belonging to the gene, just like the specific bait attracted a particular type of fish. When viewed with the naked eye, those groups of DNA strands look like small dots. Each glass slide is printed with thousands of dots arranged in an array, making up a DNA microarray.
Microarray experiments can take a lot of time. Scientists need to prepare the slides in advance and then analyse the information from thousands of spots. The analysis requires expertise in mathematics and advanced statistics, and can take months. To illustrate the underlying concepts of this technology in the classroom, you need to go virtual.
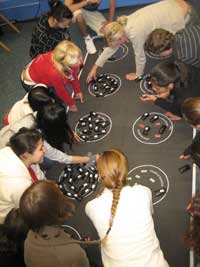
The virtual microarray, developed by the European Learning Laboratory for the Life Sciences (ELLS) at the European Molecular Biology Laboratory, is an educational activity that uses everyday materials to simulate a microarray experiment in the classroom. The game simulates the different steps that researchers take in performing microarray experiments and in analysing the results. The activity is aimed at 16- to 18-year-olds and can be used to complement lessons on genetics, cell development and genetic diseases.
The following step-by-step guide describes how a real microarray experiment is performed, alongside the steps of the virtual microarray. In this activity, the virtual microarray will be used to detect differences in gene expression between a normal cell and a cancerous cell. You can download technical information and suggestions on how to perform the virtual microarray experiment in the classroom from the ELLS TeachingBase (‘In the classroom’ PDF).
If prepared in advance, the basic exercise takes about one hour. The discussion exercises could be used in class or set for homework.
| Gene name (circles) | Gene colour | Total mRNA amount for this gene (number of Velcro strips) | Amount of mRNA in normal cell (green torches) | Amount of mRNA in cancerous cell (red torches) |
|---|---|---|---|---|
| alexander fleming | 3 | 0 | 3 | |
| barbara mcclintock | 7 | 1 | 6 | |
| francis crick | 18 | 9 | 9 | |
| jacques monod | 4 | 4 | 0 | |
| james watson | 0 | 0 | 0 | |
| john kendrew | 3 | 2 | 1 | |
| leo szilard | 12 | 9 | 3 | |
| maurice wilkins | 6 | 3 | 3 | |
| rosalind franklin | 2 | 1 | 1 | |
| thomas morgan | 12 | 4 | 8 |
Use a room or classroom that can be darkened (with curtains or blinds).
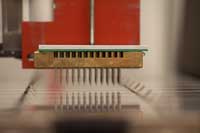
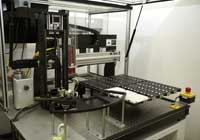
DNA microarrays are printed onto small glass slides, similar to microscope slides. Placing minute spots on this glass surface by hand is tricky, so scientists have developed special printing robots. Their printer heads have special pins that carry an aqueous solution of DNA from reservoirs and print it onto the glass surface in a grid of small spots. By controlling those robots, you can control all the features of the array: the number, size of and distance between the spots. As many as 20 000 spots can be printed onto a slide, and each spot contains billions of copies of DNA for a specific gene.
In a microarray experiment, the first step is to extract mRNA from cells of the two conditions under study, such as normal and cancerous liver tissue. mRNA is extracted by a standard lab procedure and then labelled with a fluorescent dye: for example, green for the normal cells, and red for the cancerous ones.
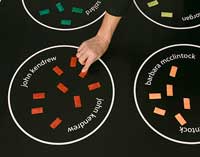
The fluorescently labelled mRNA molecules are represented by small torches. Each torch corresponds to a single chain of mRNA from a particular gene. Green torches represent mRNA extracted from a normal cell; red torches represent mRNA extracted from a cancerous cell.
In the hybridisation step, control (green) and test (red) mRNAs are mixed together, and the mRNA molecules are flooded over the surface of the microarray to bind to their complementary, immobilised DNA strands. mRNA molecules with a sequence that is not complementary to any of the genes will not bind. Those with a sequence partially similar to DNA strands from one gene will bind weakly (non-specific hybridisation). These molecules will be removed by a subsequent washing step.
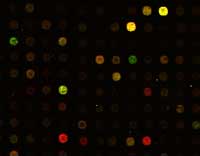
Now it is time to look at the results of the experiment to see which mRNA has hybridised with which gene. Because mRNA molecules are not visible to the naked eye, scientists can only estimate the amount of hybridised mRNA indirectly, by measuring the fluorescence of each spot. Using a special laser scanner, red and green fluorescence is detected independently and two images are produced. Putting these two images together results in a characteristic picture with coloured spots (see image on the right). A red spot indicates that the gene is active in the cancerous cell, and a green spot indicates that the gene is active in the normal cell. A yellow spot indicates that the gene is equally active in both cells types.
Microarray analysis starts with measuring the fluorescent intensity of each spot. This is done automatically by a scanner. Although analysis of the resulting images depends on the specific experiment, a typical step is to group genes with similar behaviour, in a process called clustering. After clustering, the scientists attempt to define similarities and differences among the genes belonging to the same clusters.
Depending on the clustering, you may come up with a group of the scientists who discovered the double helix, a cluster of geneticists, a cluster of scientists who did research on micro-organisms, or even scientists responsible for the establishment of the European Molecular Biology Laboratory.
After performing the virtual microarray experiment, students can discuss how microarray experiments are used in biomedical research, and the medical and ethical implications of this technology. For more information, there is a ‘Reading club’ section in the ELLS TeachingBASEw1, with simplified versions of original research articles describing how microarrays were used to answer important biological questions.
The authors would like to thank Rosanna de Lorenzi for playing and refining the activity. They would also like to express their obligation to Mehrnoosh Rayner for commenting on the article, Thomas Sandmann for help in the initial stages of the virtual microarray, and John Watson for helpful discussions.
Download this article as a PDF