


A fresh look at light: build your own spectrometer Teach article
Take a CD and a cereal box, and what do you have? With a little help from Mark Tiele Westra, your very own spectrometer! Time to explore the delights of colour, hidden in the most prosaic of objects.
Optical Astronomy
Observatory/Association
of Universities for Research in
Astronomy/National Science
Foundation
White light is not actually white – it consists of many different colours. The composition of light – its spectrum – is studied by a device called a spectrometer. In this article, we describe how one can build a fully functioning spectrometer with little more than a cereal box and a compact disc. We will use the do-it-yourself instrument to marvel at the wonderful world of hidden colours behind everyday household objects such as light bulbs, fluorescent lights, computer monitors and candle flames. Let’s explore!
How to separate light
There are different ways to split white light into its different colours. One way is to use a prism, like Newton did. Due to variations in refractive index, different colours follow distinct paths through the prism, causing the colours to separate.
Another way is to use a so-called diffraction grating, which consists of a large number of tiny grooves, placed parallel to each other on a surface, as shown below.

the surface of a compact disc
Image courtesy of Mark Tiele
Westra
The interaction of the tiny grooves with the light waves leads to the different colours being reflected in different directions.
It is very fortunate that everybody has high-quality diffraction gratings at home: compact discs (CDs). The beautiful colours that can be seen when light reflects off the surface of a CD are a clear indication that it acts like a diffraction grating. But why? The illustration above shows what a strong magnification of the surface of a CD would look like. The music is encoded in short and long pits, which are placed in a long spiral groove on the surface of the CD. The grooves, which are spaced just 1.6 µm (1600 nm) apart, act as a grating.
Constructing a cereal-box spectrograph
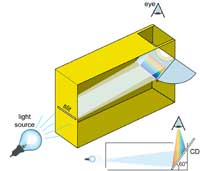
cereal-box spectrometer. The
CD is placed at a 60° angle to
the bottom of the box
Image courtesy of Mark Tiele
Westra
We can make good use of these household diffraction gratings for constructing our own spectrometer. It consists of two important elements: a CD, which separates the light into its different colours, and a narrow slit on the opposite side of the box which produces a narrow beam of light.
The slit is constructed on one side of the box using some thick paper and duct tape. A slightly fancier model can be made using the two small blades from a disposable razor, which are taped down with the sharp edges facing each other, as shown in the picture. If the slit is too broad, the spectrum will be blurred, and if it is too narrow, the spectrum will be too dim. A width of 0.2 mm seems to work well, but one can experiment. The quality of the spectra obtained is dependent on the quality of the slit, so it should be constructed with care.
On the other side of the box, a CD (the author used an empty rewritable CD, cut in half using a pair of scissors) is mounted at a 60º angle to the bottom of the box. On top, a hole is cut, through which the CD can be observed. Stray light is excluded from the box by covering any holes around the CD, as well as the edges of the CD, with dark tape.
To observe a spectrum, the slit is pointed towards a source of light (the closer the better), and the investigator looks down through the hole on top. Move the box around a little to get a feel for what to look at. Photos of the observed spectra can be made using a simple digital camera, with ‘macro’ capability for close-up focus, attached to the box by tape or rubber bands. The camera should preferably have manual focus, as it can be difficult to get sharp spectra with auto-focus.
Measurements
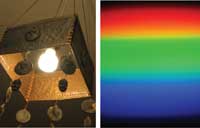
Image courtesy of Mark Tiele Westra
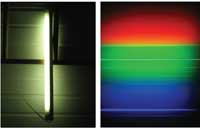
Image courtesy of Mark Tiele Westra
Time to experiment! Our first attempt is to look at the spectrum of an ordinary incandescent light bulb. The result is shown to the left.
Secondly, we look at two different fluorescent lights, which both emit white light.
The first, which is an ordinary fluorescent light, shows a number of sharp lines against the background of a continuous spectrum. These emission lines (see below) are produced by low-density mercury vapour in the tube. The mercury also produces ultraviolet light, which is turned into a continuous spectrum of visible light by a thin layer of phosphor on the inside of the tube.
The second fluorescent light (below) shows a very different spectrum. The reason is that manufacturers can vary the colour of the light by using different combinations of phosphors. The lamp illustrated uses a phosphor that emits a continuous spectrum, but this type uses so-called tri-colour phosphors: a combination of three phosphors which each has its own set of emission lines. We perceive the resulting mix of colours as white.
A small section of the screen of a laptop showing a white Word document produces the spectrum shown right. The three pixel colours that make up the image – red, green and blue – are very distinct.
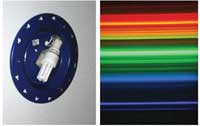
Image courtesy of Mark Tiele Westra
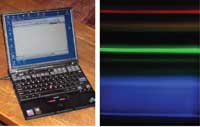
Image courtesy of Mark Tiele Westra
How spectra are formed
Some of the spectra that can be seen with the cereal-box spectrometer have a continuous background, with the colours varying smoothly from dark red to dark blue. Others consist of sharp lines on a continuous background, sharp lines without background, or even dark lines on a continuous background, like in the solar spectrum (see below). Why all this diversity? How are spectra formed?
It is all due to the atoms. An individual atom can find itself in different energy states, depending on whether its electrons occupy their usual orbits or have been excited to higher orbits. An atom cannot have just any energy: the energy levels are sharply defined, dictated by the detailed atomic structure. When an electron jumps from one orbit to another, the change corresponds to a precise amount of energy which is emitted in the form of a single photon. The energy of the emitted photon determines its colour.
candle flame produces a
sodium emission line
Image courtesy of Mark Tiele
Westra
Because many different jumps are possible, each atom can emit a range of distinct colours of light. If this light is separated by a prism or a diffraction grating, each colour is visible as an emission line in the spectrum, which is itself called a line spectrum.
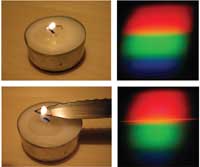
To demonstrate the formation of an emission line, we look at what happens when some ordinary table salt (sodium chloride, NaCl) is put in a candle flame. The upper pictures show the continuous spectrum of the flame itself, just like that of an incandescent light bulb. When a little table salt is put on a knife and held in the flame, a distinct orange line appears in the spectrum, which corresponds to the emission line of sodium (Na, at 589 nm).
An atom not only emits light, but also absorbs photons of the same energy that it emits. If light passes through a cold, low-density gas of atoms, the atoms in the gas absorb specific frequencies causing dark lines in the spectrum, which are called absorption lines.
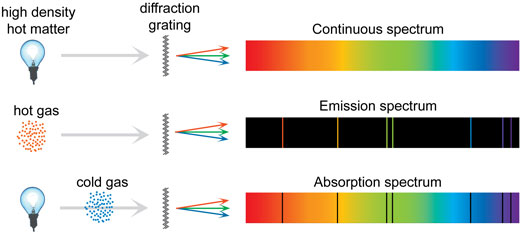
Image courtesy of Mark Tiele Westra
But if all spectra are formed by atoms emitting sharply defined colours, how are continuous spectra formed? For a single atom, unaffected by external influences, the lines are indeed sharp. This is the case in a low-density gas such as in a fluorescent tube. In a higher-pressure gas, such as the Sun, and also in fluids and solids, there are frequent collisions and many other mechanisms that cause the lines to lose their sharpness and become fuzzy, leading to a continuous spectrum. The three types of spectra are summarised in the illustration below.
Different atoms (and molecules) have different emission and absorption spectra. This difference can be exploited: just by looking at the light that comes from a distant object, for example the Sun or a star, we can tell which chemical elements are present. On Earth, this technique is used by shining light through a sample (often a gas) and measuring the absorption spectrum, from which the composition of the sample can be derived.
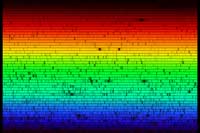
The solar spectrum
Taking our spectrometer outdoors, we can look at the spectrum of sunlight. The spectrum, shown below, looks continuous at first glance. But if we take a closer look, several dark lines can be identified, which are caused by the absorption of specific frequencies of light by atoms in the outer layers of the Sun, and in Earth’s atmosphere. The image below does not do justice to the full capabilities of the cereal-box spectrometer: with the naked eye the absorption lines can be seen in much greater detail.
The absorption lines that we observe in the solar spectrum have a name: Fraunhofer lines. Joseph von Fraunhofer (1787-1826) was the first to make a systematic study and careful measurements of these dark lines, although he was not the first to observe them. In all, he mapped over 570 lines, which he categorised and named.
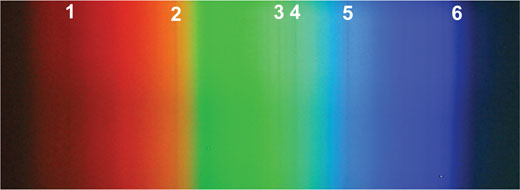
Image courtesy of Mark Tiele Westra
Around 1860, Kirchoff and Bunsen discovered that each chemical element is associated with a set of spectral lines. They deduced that the Fraunhofer lines in the solar spectrum were caused by the absorption of specific colours of light in the outer layers of the Sun. Some of the lines are also caused by the absorption of light by atoms in the atmosphere of Earth, such as oxygen. The study of these lines eventually led to the discovery of the element helium in the Sun, which ultimately provided proof that the Sun is powered by nuclear fusion.
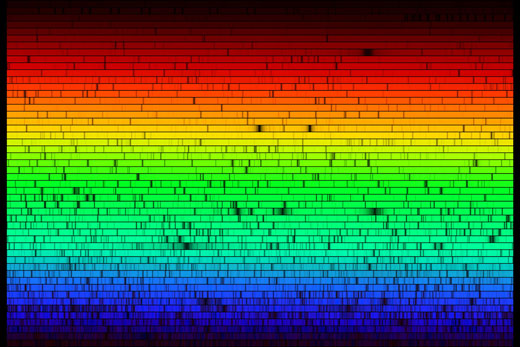
Image courtesy of National Optical Astronomy Observatory/Association of Universities for Research in Astronomy/National Science Foundation
Acknowledgements
I am indebted to Xiaojin Zhu of the University of Wisconsin-Madison, whose website provided me with all the information I needed to construct my own spectrometer and to interpret the results. On his website more spectra are available. Also thanks to Bartjan van der Meer, who put me on the trail of this fantastic science project.
Resources
- Wikipedia article on the visible spectrum
General info on spectra
- Wikipedia article on the electromagnetic spectrum
- Wikipedia article on spectroscopy
- Wikipedia article on the Fraunhofer lines
- Wikipedia article on the emission lines
Review
This article describes a very interesting hands-on experiment that can easily be replicated in class or at home. The spectrometer is constructed from common materials and is used to show the colour composition of white light and to compare the spectra of many light sources. Of particular interest is the historical background to the discovery of the light spectrum of the Sun and how it was used to identify the composition of its gases.
The article links physics and chemistry and would be interesting to both secondary school and university students.
Gaetano Bugeja, Malta