Cans with a kick: the science of energy drinks Teach article
Author(s): Emmanuel Thibault, Kirsten Biedermann, Susan Watt
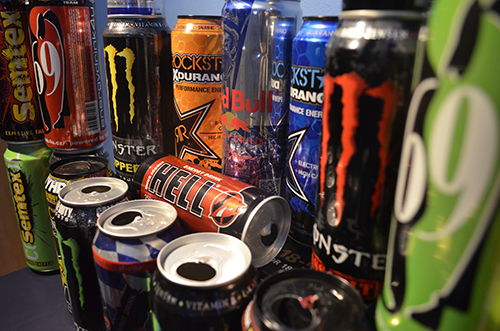
If you ever buy an energy drink as a pick-me-up, do you know what it contains? Here we use laboratory chemistry to find out.
Image courtesy of Daniel
Juřena; image source: Flickr
Look along the shelves in any local convenience store, and you’ll see an increasing number of ‘energy drinks’, all offering the promise of improved performance in sports and other activities – and with a strong appeal to many teenagers. But what’s in these drinks, and how much of it? Are they just high-priced sugar solutions – or can they actually be dangerous?
In this article, we show how you can check out some of the ingredients of energy drinks and their concentrations using the laboratory techniques of chromatography and colorimetry. Because of the advanced techniques involved, these activities are most suitable for older students (ages 14–19), and together take around 3–4 hours to complete. If your own school does not have all the equipment needed, perhaps link up with other schools: the activities work well as a collaboration.
Preparation: reading the labels
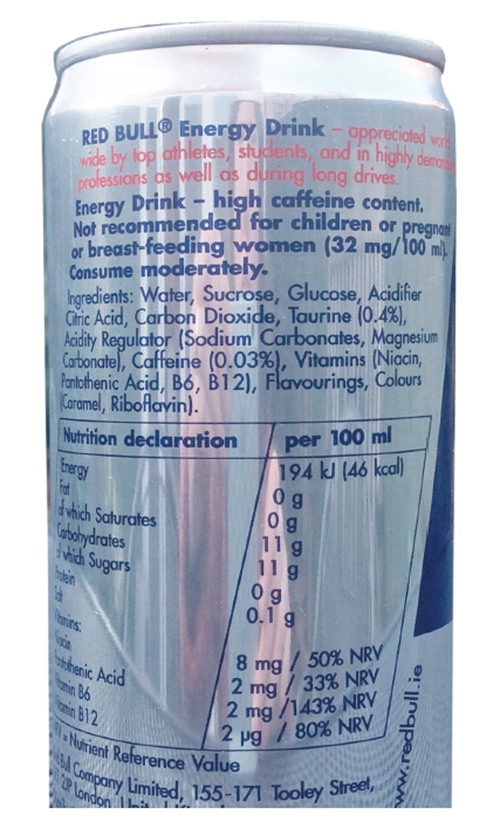
Manufacturers have to list the ingredients of energy drinks on the packaging (figure 1) or a website, so we start with this without doing any chemistry. Later on, we will compare the manufacturers’ information to the laboratory results.
Figure 1: energy drink label showing ingredients
Image courtesy of Susan Watt
The ingredient in energy drinks that has the greatest effect is caffeine, which is also found in other drinks including tea, coffee and Coca-Cola®. Its effect as a stimulant is well known. In this preparatory activity, students research and compare caffeine concentrations in different drinks and work out how many portions would be needed to cause harmful side-effects. We suggest allowing 30–60 minutes for this activity.
Materials
Internet access to carry out research
Notebooks to record findings
Procedure
Ask the students to do the following, on their own or in groups:
Make a list of around five energy drinks, especially those that are promoted as containing caffeine. Include coffee (as a single espresso) for comparison.
Use the internet to research each drink’s ingredients, including caffeine. Note the amount of caffeine in a single can or bottle and per 100 ml, if listed. If not, note the volume of the can or bottle so that you can work out the caffeine concentration (we will use this in one of the experiments).
Use the internet to find out the caffeine dose at which harmful side-effects are expected. Does this depend on any other factors, e.g. body weight, or whether the consumer is an adult or a child?
Make a table showing the following characteristics for each drink:
List of ingredients
Amount of caffeine in one can
How many single espressos this is equivalent to
How many cans you would need to drink to risk harmful side-effects.
Discussion
Discuss the results as a class. What do students conclude about the ingredients of energy drinks and how safe they are? Could they kill you?
In our research, we found that an average can (250 ml) of an energy drink contains about 80 mg of caffeine, which is similar to the amount in a single espresso (60–100 mg). This is close to the dose that is likely to cause side-effects (100–160 mg).
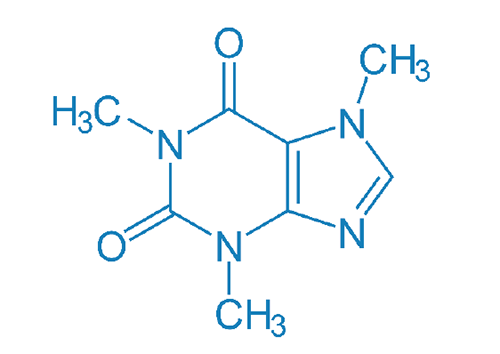
Figure 2: the molecular structure of caffeine
Image courtesy of Emmanuel Thibault and Kirsten Biedermann
Extracting the caffeine
Now we move on to the practical chemistry: extracting the caffeine and other organic compounds from the energy drink, and then identifying the caffeine using thin-layer chromatography. This activity takes 1.5–2 hours to complete.
Safety note
This procedure involves the use of pure caffeine (figure 2), which is toxic and should therefore not be available to students as a reagent. Teachers are advised to prepare the very small quantities needed for the experiment in advance.
2 x 15 ml of an organic solvent that evaporates easily, e.g. ethyl ethanoate (ethyl acetate)
10 ml of a 1 M solution of suitable alkali, e.g. sodium carbonate
10 g anhydrous magnesium sulfate (for drying)
Rotary evaporator, if available
Universal indicator paper
Separating funnel
Filter paper
100 ml beakers
Graduated cylinder
Glass rod for stirring
For the chromatography
Stationary phase: thin-layer chromatography plates pre-coated with silica gel, about 10 cm x 5 cm
Eluent (mobile phase): 10 ml of a mixture of 30% methanoic (formic) acid and 50% butyl ethanoate (butyl acetate)
Sample of pure caffeine (to provide a reference spot), made by dissolving the tip of one spatula of caffeine in 2–3 ml of ethanol
UV light source
Procedure
Take 50 ml of the energy drink and add it to 9 ml of a 1 M solution of sodium carbonate in a beaker.
Using indicator paper, check that the pH of the solution is between 8 and 10. If not, adjust the pH by adding a little more alkali or energy drink.
Pour this solution into a separating funnel and add 15 ml of ethyl ethanoate. Shake the mixture well and leave it to settle so that the aqueous phase and the organic phase separate.
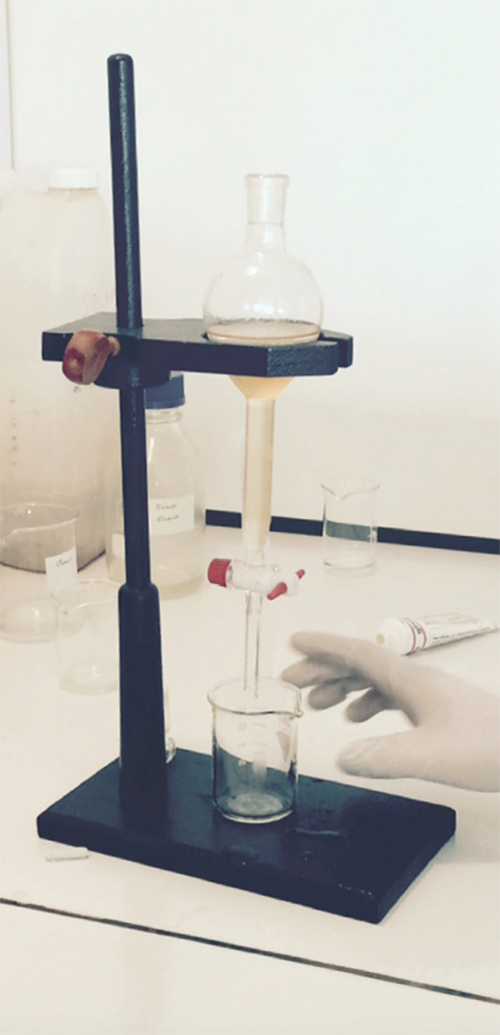
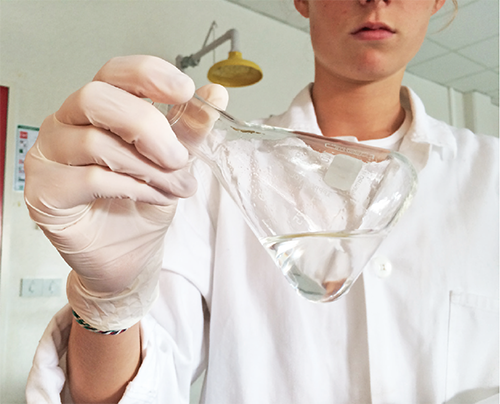
Run off the aqueous phase (lower layer), then collect the organic phase (the top layer) in a clean beaker (figure 3).
Add another 15 ml of ethyl ethanoate to the beaker containing the organic phase and repeat the operation, shaking and then collecting the organic phase.
Figure 3: extracting the organic phase (containing caffeine) using a solvent
Image courtesy of Emmanuel Thibault and Kirsten Biedermann
Remove the water from the organic phase by adding the anhydrous magnesium sulfate (figure 4).
Figure 4: drying the organic phase using anhydrous magnesium sulfate
Image courtesy of Emmanuel Thibault and Kirsten Biedermann
Evaporate the solvent from the organic phase using the rotary evaporator, if you have one. The water bath temperature should be 40 °C. Once the solvent has evaporated, you are left with a white powder – this is the caffeine extract. If you don’t have a rotary evaporator, continue to the next step with the caffeine extract still dissolved in the solvent.
Now you are ready to analyse your sample. If you evaporated the solvent, add 1 ml of ethyl ethanoate to the caffeine extract powder to re-dissolve it.
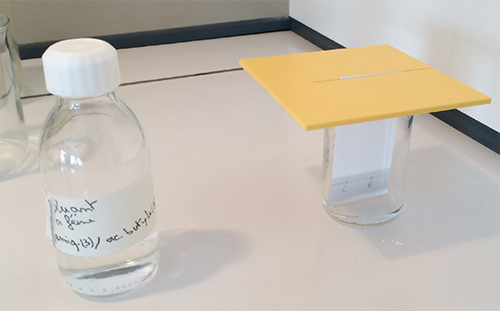
To begin the chromatography, prepare the 10 ml of eluent and pour this mixture into an elution tank (or a beaker with a cover).
On a chromatography plate, make one spot using the pure caffeine solution (as a reference) and one spot using the caffeine extract solution.
Allow the chromatography to proceed (figure 5; 10–15 mins), and then carefully remove the chromatogram.
Figure 5: using chromatography to separate and identify the caffeine
Image courtesy of Emmanuel Thibault and Kirsten Biedermann
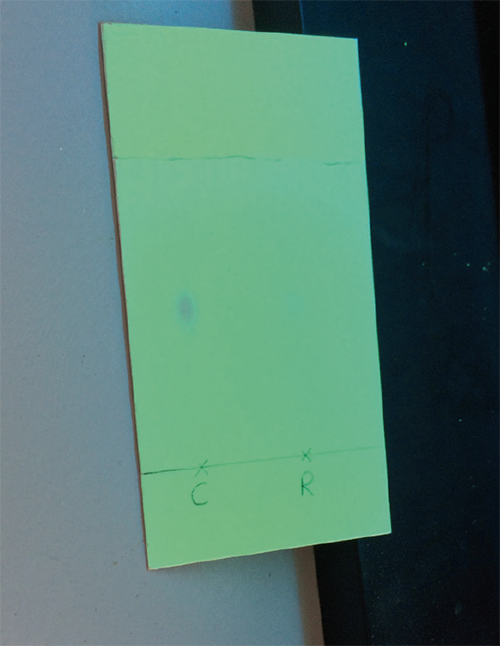
Finally, view the chromatogram under UV light, so that the spots become visible (figure 6). What do you see?
Figure 6: viewing the chromatogram under UV light
Image courtesy of Emmanuel Thibault and Kirsten Biedermann
Discussion
After the practical work, the whole class can discuss what they found. Try the following questions:
In the extraction, why is the caffeine found in the liquid and not on the filter paper? (The caffeine dissolves in the solvent.)
Why do we use an organic solvent for the extraction rather than water? (Sugars and minerals dissolve in the water, while caffeine dissolves better in organic solvents.)
Why is UV light needed to see the caffeine on the chromatogram? (Caffeine is not coloured, but its chemical bonds absorb light in the near-UV region.)
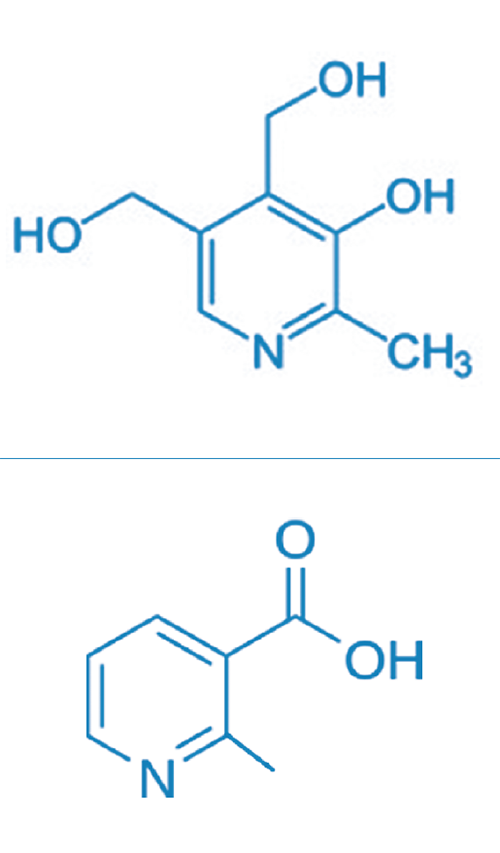
For some drinks, there will be other spots visible on the chromatogram under UV light as well as caffeine, which students can try to identify from the drink’s list of ingredients. Probable compounds are the vitamins B3 (niacin) and B6 (pyridoxine), because some of the bonds (figure 7) in these compounds also absorb light in the near-UV region.
Figure 7: the molecular structures of B6 (pyridoxine; above) and B3 (niacin; below)
Image courtesy of Emmanuel Thibault and Kirsten Biedermann
Testing the concentration
In this final activity, we use another chemical technique – colorimetry – to work out the concentration of caffeine in an energy drink and compare this to the advertised figure. Allow 60–90 minutes for this activity.
The strategy here is to use a set of reference solutions of caffeine at different known concentrations, and to compare the absorption of the energy drink to these values via a calibration graph.
Safety note
As with the previous activity, this procedure involves the use of pure caffeine, which is toxic and should therefore not be available to students as a reagent. Teachers are advised to prepare the reference solutions of caffeine needed for the experiment in advance.
Reference solutions of pure caffeine in distilled water at concentrations of 5, 10, 20 and 50 mg/l (at least 20 ml of each)
Distilled water
Colorimeter that is sensitive to wavelengths between 250 nm and 380 nm (near-UV light)
20 ml volumetric flask
Pipette
Weighing balance and weighing dish
Procedure
Calibrate the colorimeter using distilled water.
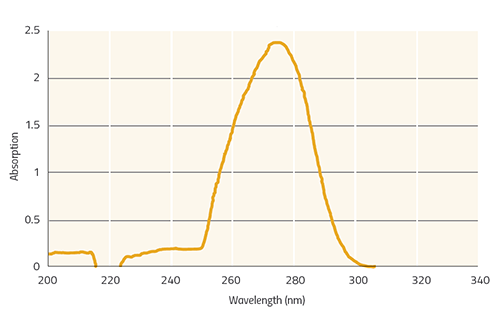
Using the colorimeter, measure the absorption at 271 nm of each reference solution in turn and record these readings. (Caffeine absorbs very strongly at this wavelength; figure 8.)
Figure 8: graph showing absorption spectrum of caffeine, 200–340 nm region
Image courtesy Emmanuel Thibault and Kirsten Biedermann
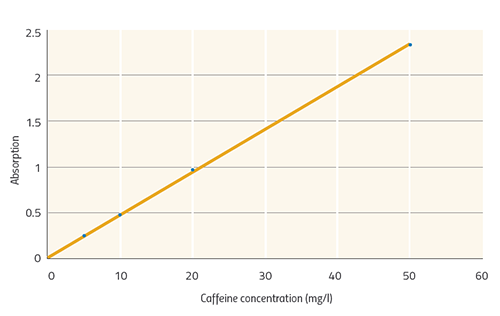
Use the readings to plot a calibration graph linking absorption at 271 nm to caffeine concentration, drawing a straight line of best fit between the points (figure 9).
Figure 9: calibration graph showing increase in absorption at 271 nm with caffeine concentration
Image courtesy Emmanuel Thibault and Kirsten Biedermann
Using a volumetric flask and pipette, dilute the drink by a factor of 20. (In normal concentrations, the absorption of caffeine is too high for the colorimeter to measure accurately.)
Measure the absorption of the diluted drink at 271 nm.
Using the calibration curve you have drawn, estimate the caffeine concentration of the diluted drink solution. Multiply this by 20 to find an estimate of the caffeine concentration of the original energy drink, in mg/l.
Compare this result to the concentration of caffeine stated by the manufacturers (making sure you are using the same units in each case). Are they the same? If not, can you think of any possible reasons why this is? Has the manufacturer cheated?
Discussion
Ask students to compare their results for the caffeine content of different energy drinks as a class discussion.
Then discuss what they found when they compared their own results to those published by the manufacturers. Were any of the experimental results higher than those published?
To explain this, students should think back to the first part of the experiment where some compounds other than caffeine were revealed by the chromatogram – typically the vitamins B3 and B6. In fact, these same compounds also absorb at the 271 nm wavelength, so they increase the energy drink’s absorption at that wavelength. So when the drink’s absorption is used to find the caffeine concentration via the calibration graph, the reading is higher than it should be as a measure of the caffeine alone.
Caffeine and the brain
Energy drinks are popular because of their branding and association with sports and physical stamina. But can they also affect the way our brains work by stimulating our mental powers?
If you would like to find out about ways to investigate this, two classroom experiments that assess mental agility by measuring thinking and reaction times can be downloaded from the additional material sectionw1. One is a number-matching task, the other a catching task.
Acknowledgement
This article is based on an activity published by Science on Stage, the network for European science, technology, engineering and mathematics (STEM) teachers, which was initially launched in 1999 by EIROforum, the publisher of Science in School. The non-profit association Science on Stage brings together science teachers from across Europe to exchange teaching ideas and best practice with enthusiastic colleagues from 25 countries.
At Science on Stage workshops, as well as discussions via email, 20 teachers from 15 European countries worked together for 18 months to develop 12 teaching units that show how football can be used in physics, chemistry biology, maths or IT lessons. These units were then published in 2016 by Science on Stage Germany as iStage 3 – Football in Science Teachingw2. The project was supported by SAP.
The follow-up activity of iStage 3 is the European STEM League, which readers are invited to join and compete to become the European STEM Championw3.
Web References
w1 – Download the supporting classroom experiments from the additional material section.
Emmanuel Thibault is an associate professor of physics and chemistry at Vaucanson High School in Tours, France. As well as teaching, he works on scientific and technical projects with his students, which has allowed them to win several prizes in national and international contests. Since 2013, Emmanuel has been involved with Science on Stage, and he contributed to the recent iStage 3 publication.
Kirsten Biedermann teaches at Widukind-Gymnasium (high school) in Enger, Germany. A graduate in physics, mathematics, fine arts and education, he specialises in teaching gifted and special-needs students. He is president of Ravensberger Erfinderwerkstatt, a non-profit club that supports STEM activities for young people, and is also active with Science on Stage, presenting projects at national and international festivals.
Susan Watt worked as a freelance science writer and editor before joining Science in School as an editor in 2016. She studied natural sciences at the University of Cambridge, UK, and has worked for many publishers and scientific organisations, including UK science research councils. Her special interests are in psychology and science education.
Review
Do you need to teach organic chemistry but are worried that your students are not enthusiastic about the subject? Then this article is what you need to really engage your students.
Starting from energy drinks, a very popular beverage among teenagers, the authors provide activities that cover a wealth of science topics ranging from chemistry (including analytical techniques) to physics, biology, and health and nutritional education.
The activities begin with a web quest before continuing to qualitative and quantitative investigations, which together provide a progressive understanding of the topic and ensure your students stay engaged.
The activities may also be valuable for promoting critical thinking and encouraging students to make responsible choices about nutrition and health.
The online extension activity provides teachers with the opportunity to perform inspiring experiments on the effect of energy drinks on the brain, with further opportunities to address scientific methods, experiment planning and data processing.
Possible questions include:
Which of the following beverages does not contain caffeine?
Tea
Beer
Coca-Cola
Espresso
How much caffeine is contained in one litre of an average energy drink?
120 mg
320 mg
520 mg
720 mg
The concentration of caffeine in energy drinks measured with a colorimeter (according to the article protocol) is:
Lower than that stated by manufacturer due to the presence of vitamin B3 and B6
Higher than that stated by manufacturer due to the presence of vitamin B3 and B6
Equal to that stated by manufacturer because vitamin B3 and B6 do not interfere
Higher than that stated by manufacturer due to the presence of vitamin B3, C and B12