Supporting materials
Download
Download this article as a PDF

Building a hypothetical family portrait can help students to understand genetics.
Looking for a way to assess whether your biology students truly understand key genetics terminology, such as dominant and recessive or genotype and phenotype? This activity presents a fun, collaborative and interdisciplinary way to get students excited about the study of human genetics. Students pair up to create a genetic portrait of their imaginary family based on several observable, heritable traits. By actively using their knowledge, students will appreciate the importance and meaning of the study of genetics in its real-life context.
Terminology such as genotype, phenotype, homozygous and heterozygous is prevalent in every biology classroom, yet can be cumbersome and difficult for students to comprehend, especially if it is not taught in a way that promotes active learning and collaboration (Nowak & Plucker, 2002).
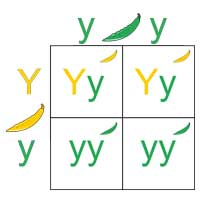
A genetics unit usually begins by introducing how certain traits or physical characteristics arise in individuals in different generations of the same family. The assessment activity described here allows students to demonstrate an understanding of concepts such as the difference between dominant and recessive traits and genotypes. They will use this knowledge to construct Punnett squares for heritable traits. Students will then predict the possible outcomes of genetic crosses to make an album of ‘family portraits’ that accurately depict the phenotypes of parents and offspring.
To begin the family portrait project, allow students to pair up – ideally with a student of the other gender. However, in single-sex schools, or classes without an even gender split, this may not be possible.
First, the students should complete worksheet one in detailw1 to help them determine their own phenotype, and possible genotype, for severable observable traits. Students start by examining a selection of their own physical features, including everything from the presence of freckles to the ability to roll their tongues. My students expressed a great deal of excitement and surprise to realise that characteristics they rarely consider are actually dominant or recessive traits.

Student pairs should then randomly select the gender of up to seven children by tossing a coin or picking marked cards from a bag. To make the activity more realistic, we also included phrases such as ‘twin boys’ or ‘triplet girls’ in the bag. Once the genders of children have been selected, the student pairs can construct genetic crosses for their heritable traits. Students should then use worksheet twow2 to organise the genotypes and phenotypes for their families as they construct their crosses. Remind students that genetics is very complex and that in the real world, relationships cannot be established by considering a small number of traits that may also be affected by environmental factors.
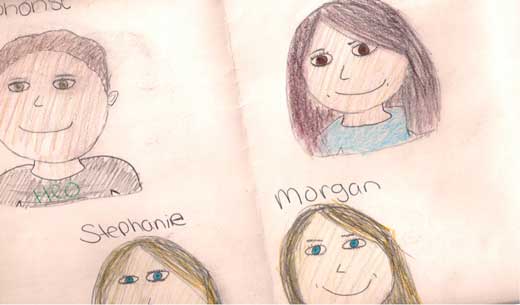
Once the genotypes and phenotypes are determined for each of the possible offspring, the family portraits may be constructed. Students are provided with crayons, coloured pencils, paints and construction paper. The portrait for each child must accurately depict the phenotypes obtained during their genetic crosses. Students can be as imaginative and creative as they would like during this phase of the project (figure 1). Perhaps the most intriguing aspect of this project is its interdisciplinary nature. We were able to incorporate this project into the art teacher’s unit on composite sketches and portraits.
Partner 1: ____________________________________
Partner 2: ____________________________________
Evaluation:
| Content | Criteria Assessed | Skill Evaluation | Point Value | Points Earned |
|---|---|---|---|---|
| Parent/Child Sheet | The genotype/phenotype of both team members is correctly labeled on the chart. | Chooses and applies appropriate strategies to address subject. | 15 | |
| Punnett Squares | Genetic crosses are provided for each of the indicated traits. | Genotypic and phenotypic percentages are indicated for each cross. | 10 | |
| Family Portrait | Provides a sufficient attempt at artistic excellence. The drawing appears to be well thought out and detailed based on the information provided in the chart. | Solves problems and reasons effectively. | 20 | |
| Each trait for each child is evident from the drawing or is labelled to guide the reader in determining the phenotype. | Identifies all important elements of the problem. | 10 | ||
| Total | 55 |

We have provided an evaluation rubric to assist the teacher in gauging whether students have accurately depicted a family portrait, accounting for the genotypes and phenotypes of each parent and all offspring (see above). Students will submit all illustrations and Punnett squares for evaluation as well. One of the hallmarks of this activity is that it provides multiple forms of authentic assessment for students to showcase their learning. Students who are comfortable with working in teams and artistically depicting information reached proficiency with construction of the family portrait. Students who are strong writers were very comfortable and successful completing the worksheets.
It is strongly encouraged that formative assessment occurs throughout the lesson by observing students’ knowledge and/or skills, noting their application of new concepts and change in thinking, not just factual recall.
Biology is a fascinating discipline to motivate students’ curiosity and engagement, particularly in the study of genetics. Students often struggle to make integral connections between different concepts and may not see the real-life applications of what they are learning. By providing dynamic assessments that allow students to have conversations and receive real-time feedback on their strengths and weakenesses, we can only increase students’ information retention (Van Scotter & Pinkerton, 2008). These balanced assessments also provide students with expectations at the beginning of a project, so they know ahead of time what is important and what characteristics a high-quality assessment product will have.
This is an interesting activity that could easily be adapted to a range of age groups and abilities. The author has designed it to help students understand Mendelian genetics – and to help teachers identify which students are having problems and which ones ‘get it’. The family portraits that make up the final part of the activity inject cross-curricular possibilities, and it would not be hard to develop extension activities as well. The instructions for students are easy to follow and the evaluation form has been designed to help students and teachers to see how well Mendelian genetics has been understood.
Devon Masarati, UK
Download this article as a PDF